
Latest News
2022 Start working on a new website
BBS Trading Expert
Watch the Youtube BBS video and here is a crude oil trading example
Want to know more about:
AXIOM business books awards, bronze medal! Thank You!
No longer available!
Favorite articles in 2010, 11, 12, 14 and 2015 S&C Readers' Choice Awards.

AXIOM Business Books Awards, bronze medal.

Band Break System BBS
BBS - Intro - Results - Template - Basic - More_money - Selecting_stocks
The BBS Band Break System is a trend following system. It is based on the idea that trading stocks, you need a minimum reversal amount before you can assume a change of trend. For a BBS buying signal this means the upper side of the band needs to be broken by the closing price.
Once in a trade you need to leave sufficient room for short term price reactions. You will stay in the trade as long as price remains above the lower band of BBS. That will allow sufficient room for short term reactions. Finally the trade is closed when the lower band of BBS is broken by a closing price.
In a trend following system in general, trading long is profitable as long as price makes medium to longer term up moves. Trading all the time downward corrections is not profitable. For that reason we will only go for short trades during longer time down trends in the market. To enter a short trade we need a signal from BBS with a closing price below the lower BBS band AND the closing price must be below the 165 days simple moving average. Only that way short trades will contribute to a higher profit.
For trading the BBS system, we use the BBS chart template. BBS can be used in any time frame.
BBS Chart Template part 1
First we just create a candle chart and put the S10_BandBreak indicator over the price bars, of course using the same scale as the price bars. The green line is the upper side of the trading band and the orange line is the lower side of the trading band.
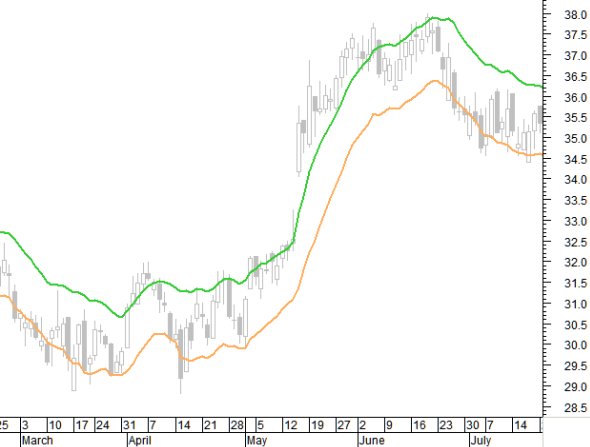
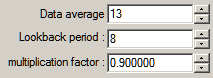
The S10_bandbreak indicator uses 3 parameters. A data average, a look back period and a multiplication factor. The defaults used are respectively: 13, 8 and 0.9.
Next we add 3 averages: a 50 (blue), 100 (red dashed) and 165 (red) simple moving average.
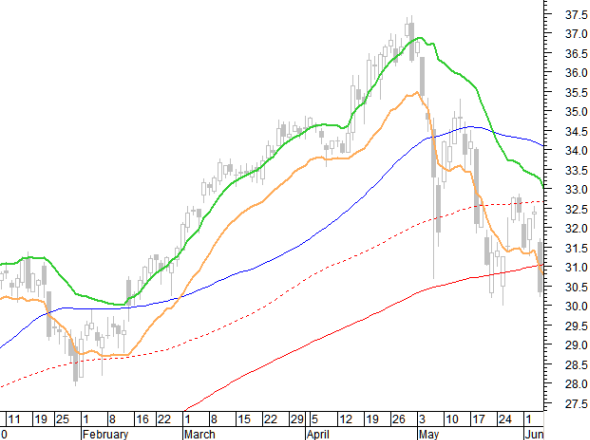
Actually this is all you need for trading the basic BBS system. However, no system is perfect, so we will try to avoid some of the losing trades. And for that we will add a couple of extra indicators in the next page that will help you to make decisions to override the BBS signal.
BBS Chart Template Next -Previous
STOCATA Stocks Technical Analysis HOME
Links
Find a Stock ticker symbol, enter the ticker and find a chart, news, fundamentals and historical quotes.
Risk Disclosure: Futures and forex trading contains substantial risk and is not for every investor. An investor could potentially lose all or more than the initial investment. Risk capital is money that can be lost without jeopardizing ones’ financial security or life style. Only risk capital should be used for trading and only those with sufficient risk capital should consider trading. Past performance is not necessarily indicative of future results.
Hypothetical Performance Disclosure: Hypothetical performance results have many inherent limitations, some of which are described below. no representation is being made that any account will or is likely to achieve profits or losses similar to those shown; in fact, there are frequently sharp differences between hypothetical performance results and the actual results subsequently achieved by any particular trading program. One of the limitations of hypothetical performance results is that they are generally prepared with the benefit of hindsight. In addition, hypothetical trading does not involve financial risk, and no hypothetical trading record can completely account for the impact of financial risk of actual trading. for example, the ability to withstand losses or to adhere to a particular trading program in spite of trading losses are material points which can also adversely affect actual trading results. There are numerous other factors related to the markets in general or to the implementation of any specific trading program which cannot be fully accounted for in the preparation of hypothetical performance results and all which can adversely affect trading results.
See more 'Legal Disclosures' in the bottom menu bar!