
Latest News
2022 Start working on a new website
BBS Trading Expert
Watch the Youtube BBS video and here is a crude oil trading example
Want to know more about:
AXIOM business books awards, bronze medal! Thank You!
No longer available!
Favorite articles in 2010, 11, 12, 14 and 2015 S&C Readers' Choice Awards.

AXIOM Business Books Awards, bronze medal.

LOCKIT Trading Application Example
LOCKIT Trading example “CMS Energy Corp”
Opening a long equity position
The date is 03/31/2006.
The stock we are looking at is CMS Energy Corp.
We already know from the S&P500
index that the long term trend is up.
We are therefore looking to buy CMS Energy Corp.
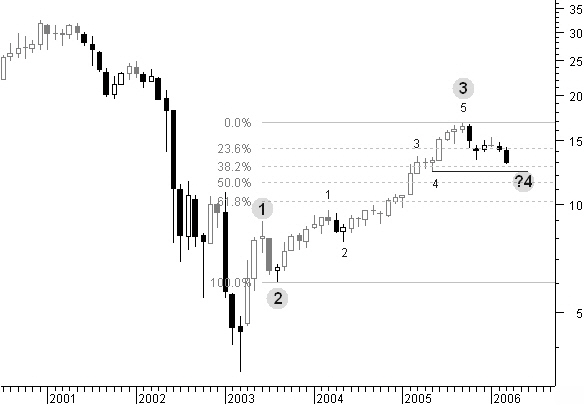
Figure 2.1: Monthly chart CMS Energy Corp in a long term up trend.
In figure 2.1 a monthly chart of CMS there is a long term up trend since 2003, but now we notice a reaction phase.
Introducing an Elliot wave count, it looks like we are in a consolidation phase for wave 4. We have an impulse wave up with waves 1, 2 and 3. Wave 3 has an extension with waves 1 to 5.
Special offer: "Capturing Profit with technical Analysis"
Looking at theoretical values, we know that wave 4 retraces usually 23.6% up to 38.2% of wave 3; many times this is also the level of intermediate wave 4.
Here this would mean that we must be close to a price reversal. However, do not forget we are looking at a monthly chart so it still might take some time!
Weekly Chart
Looking at the weekly chart of figure 2.2, we have confirmation that we must be close to the end of correction wave 4. Price is moving below the 50-weeks simple average, but above the 200-weeks simple moving average, which is still moving down but less steep.
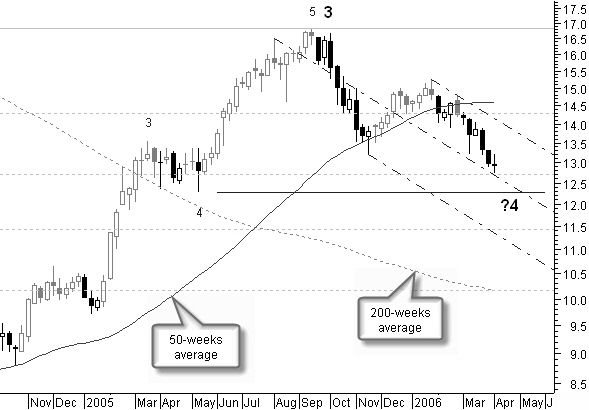
Figure 2.2: CMS weekly chart confirms possible end of reaction phase.
A pitchfork (dash-dotted line), touching price at different levels, gives a good idea of the directional move of the price. However, price has not yet touched the median line; we are expecting a further move down to penetrate the median line.
One week later:
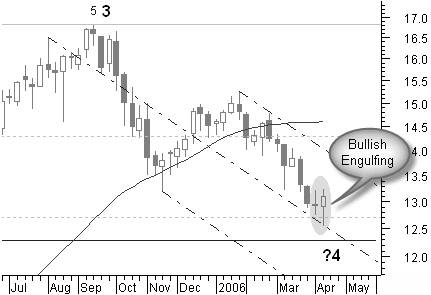
Figure 2.3: CMS 1 week later, price now touching the median pitchfork line
04/13/2006: in figure 2.3 the low price is now touching the median line of the pitchfork. We have a bullish engulfing signal in de candlestick chart. We are at a bigger distance from the 50-weeks average. A retrace to this average is probably the first step creating an Elliott impulse wave 5.
LOCKIT Stock Trading Example Next -Part 1 -Part 2 -Part 3 -Part 4
STOCATA Stocks Technical Analysis HOME
Links
Find a Stock ticker symbol, enter the ticker and find a chart, news, fundamentals and historical quotes.
Risk Disclosure: Futures and forex trading contains substantial risk and is not for every investor. An investor could potentially lose all or more than the initial investment. Risk capital is money that can be lost without jeopardizing ones’ financial security or life style. Only risk capital should be used for trading and only those with sufficient risk capital should consider trading. Past performance is not necessarily indicative of future results.
Hypothetical Performance Disclosure: Hypothetical performance results have many inherent limitations, some of which are described below. no representation is being made that any account will or is likely to achieve profits or losses similar to those shown; in fact, there are frequently sharp differences between hypothetical performance results and the actual results subsequently achieved by any particular trading program. One of the limitations of hypothetical performance results is that they are generally prepared with the benefit of hindsight. In addition, hypothetical trading does not involve financial risk, and no hypothetical trading record can completely account for the impact of financial risk of actual trading. for example, the ability to withstand losses or to adhere to a particular trading program in spite of trading losses are material points which can also adversely affect actual trading results. There are numerous other factors related to the markets in general or to the implementation of any specific trading program which cannot be fully accounted for in the preparation of hypothetical performance results and all which can adversely affect trading results.
See more 'Legal Disclosures' in the bottom menu bar!