
Latest News
2022 Start working on a new website
BBS Trading Expert
Watch the Youtube BBS video and here is a crude oil trading example
Want to know more about:
AXIOM business books awards, bronze medal! Thank You!
No longer available!
Favorite articles in 2010, 11, 12, 14 and 2015 S&C Readers' Choice Awards.

AXIOM Business Books Awards, bronze medal.

Exploring Charting Techniques
PART VI - Projecting Market Cycles
Market Cycles
There are many ways to approach it and many have tried, but only a handful of techniques work well to identify cycles. In this article, I’ll discuss a unique method that uses trend channels to find the beginnings and ends of cycles.
Channel Moves
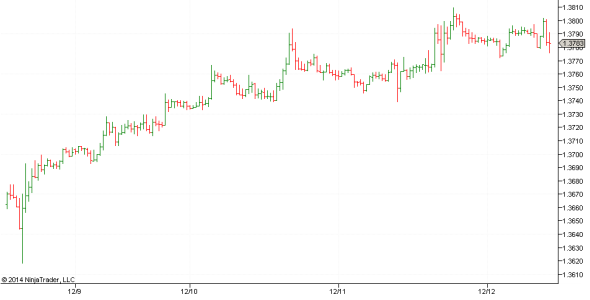
First, let’s look at the chart in Figure 1, which shows an uptrend move on a 30-minute chart of the EURUSD. If you try to draw a trendline or a trend channel on this price chart, you may get frustrated. It may be impossible to draw a channel that covers the entire period displayed on the chart. If you start the trendline from the sharp up move, the corrections will break the possible trendline and there will be long periods with limited trading ranges. In order to create trendlines and channels, you may need to use a different kind of chart.
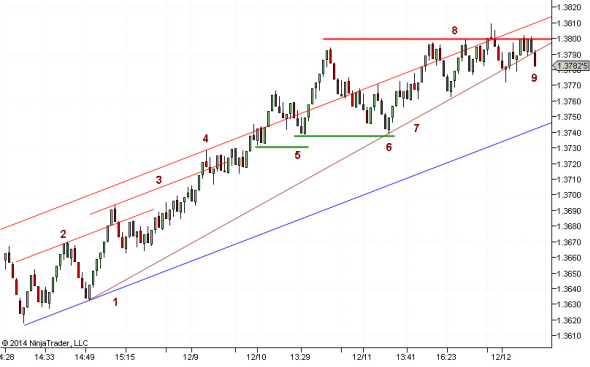
In Figure 2 you see a 10-pips range bar chart of the EURUSD over the same period of time as that of Figure 1. The area where the chart begins is the bottom of the end of a previous correction. From that low there was a 1-2-3 correction pattern to the top at 2. This was followed by a downward correction and a new upturn with a higher bottom than the previous ones. Once you have this reference point, you can draw the blue uptrend line. This uptrend line has a moderate slope, which will likely hold for a longer period of time. To create a channel, you can draw a red parallel line through the top at 2. One basic rule you must keep in mind is that the uptrend will remain valid as long as there are higher bottoms and higher tops. After the top at 2, there was a higher top, which allowed you to draw a new parallel line 3, widening the channel. Similarly, another higher top at 4 widened the channel even further. In fact, this channel is now wide enough because a move to the low side of the channel will be close to the last low support level. Thus, I can project the upper side of the channel further into the future. Once again, you get a higher top outside of the channel, but it corrects back into the channel. If price broke the last support level of the previous low, which is the green horizontal line at 5, then you would have to close the trade. This did not happen and the up move resumed, creating a new higher high level. This one was followed by a larger correction, but it still found support at the last low, which is the green line at 6. Price continued moving higher and reached a new top, which was just a fraction higher than the previous top, after which price reacted with a higher low. This limited new high could be a possible sign that the end of this trend move is near. So you draw a sharper uptrend line, in this case, the brown line 7, which now has three support points. Three more tops are created, but it is clear by now there is heavy resistance at the red resistance line 8. Finally, when the closing price falls through the brown uptrend line at 9, it is best to close the trade and take profit. It is likely that prices have reached the end of this up cycle.
.......... Read the full article in the Stocks & Commodities December 2014 issue..........
STOCATA Stocks Technical Analysis HOME
Links
Find a Stock ticker symbol, enter the ticker and find a chart, news, fundamentals and historical quotes.
Risk Disclosure: Futures and forex trading contains substantial risk and is not for every investor. An investor could potentially lose all or more than the initial investment. Risk capital is money that can be lost without jeopardizing ones’ financial security or life style. Only risk capital should be used for trading and only those with sufficient risk capital should consider trading. Past performance is not necessarily indicative of future results.
Hypothetical Performance Disclosure: Hypothetical performance results have many inherent limitations, some of which are described below. no representation is being made that any account will or is likely to achieve profits or losses similar to those shown; in fact, there are frequently sharp differences between hypothetical performance results and the actual results subsequently achieved by any particular trading program. One of the limitations of hypothetical performance results is that they are generally prepared with the benefit of hindsight. In addition, hypothetical trading does not involve financial risk, and no hypothetical trading record can completely account for the impact of financial risk of actual trading. for example, the ability to withstand losses or to adhere to a particular trading program in spite of trading losses are material points which can also adversely affect actual trading results. There are numerous other factors related to the markets in general or to the implementation of any specific trading program which cannot be fully accounted for in the preparation of hypothetical performance results and all which can adversely affect trading results.
See more 'Legal Disclosures' in the bottom menu bar!