
Latest News
2022 Start working on a new website
BBS Trading Expert
Watch the Youtube BBS video and here is a crude oil trading example
Want to know more about:
AXIOM business books awards, bronze medal! Thank You!
No longer available!
Favorite articles in 2010, 11, 12, 14 and 2015 S&C Readers' Choice Awards.

AXIOM Business Books Awards, bronze medal.

S&P500 Analysis: -Daily -Weekly -Monthly -Template -Formulas -Real-Time - HOME
S&P500 Technical Analysis
Please look at all charts, monthly, weekly and daily before making your own conclusion. You can find HERE a description of the chart template used.
Daily Chart
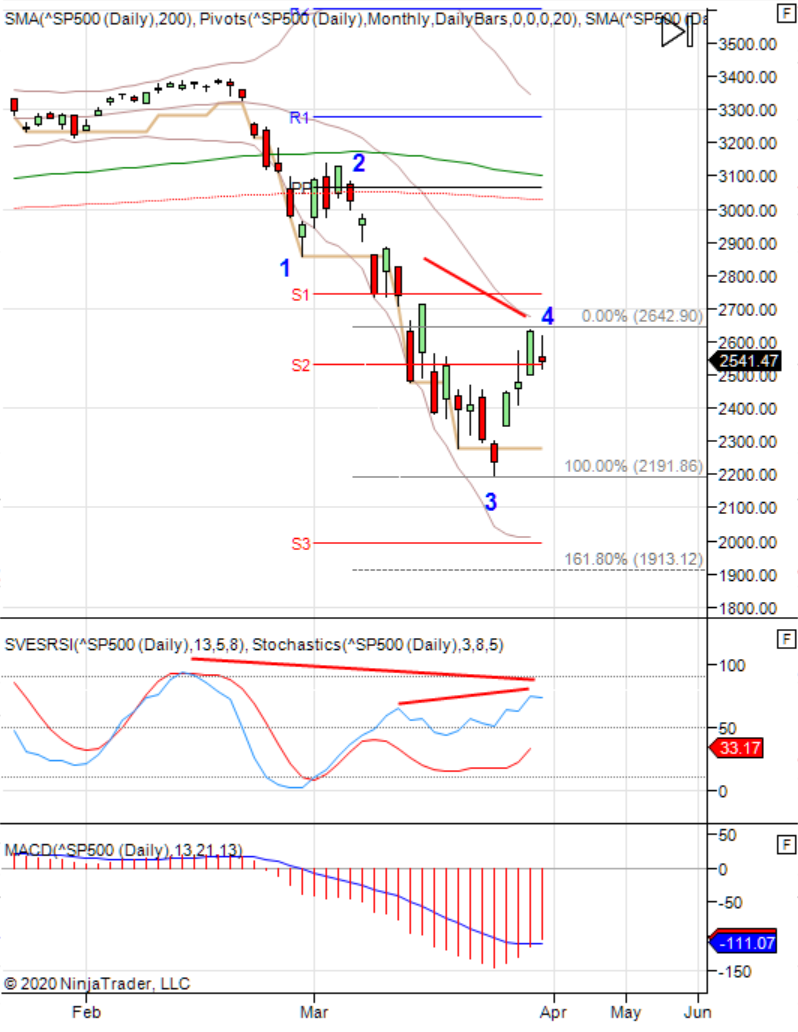
03/28/2020
In the daily chart it looks like a bottom was made on Monday to complete the wave 3 down. Followed by a four days move up, most probably finishing correction wave 4. If we really have the top for wave 4, you can see a short term hidden divergence with, a lower top in the index and a higher top in the SRSI indicator. You can also see a a convergent move with both a lower top in price and the indicator. Both of them usually signal the start of the down move continuation. We are expecting the wave 5 down. Projecting a Fibonacci target down over the wave 4 gives a 161.8% price target at 1913. This is of course only true if the wave 4 is confirmed with lower prices the coming week. Keep in mind that reaching wave 5 down is normally the first correction wave A down. After that there will be a correction wave up but, followed by the wave C down for new lows...
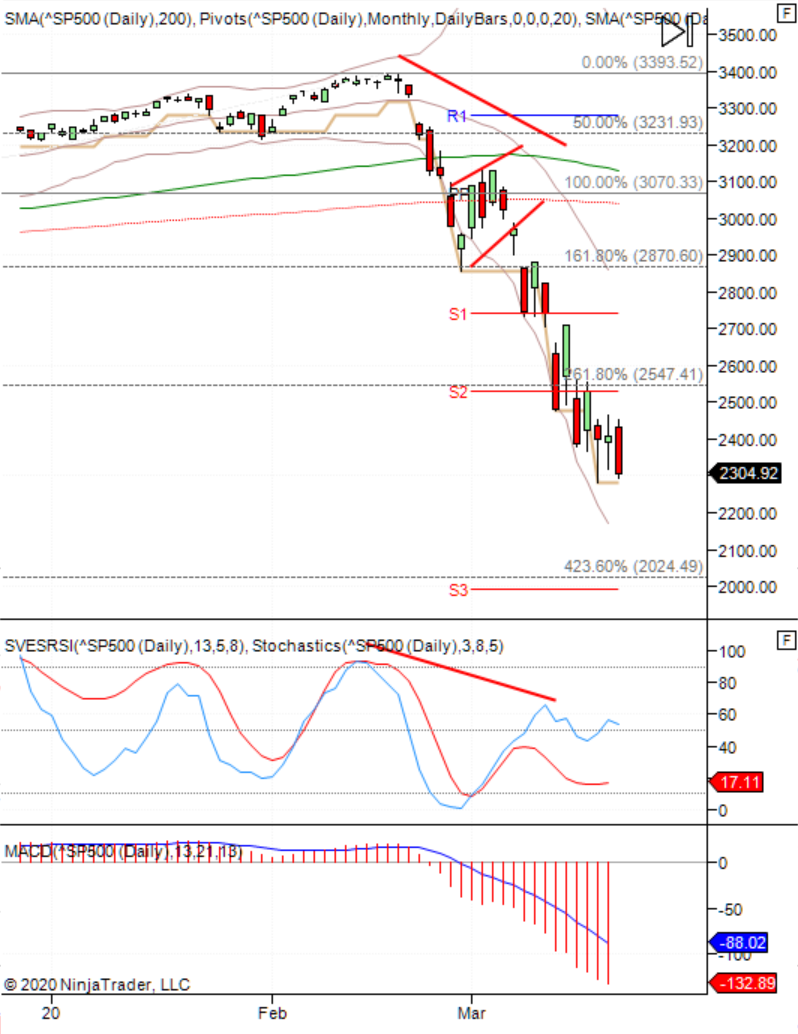
03/21/2020
In the daily chart there was no further up reaction. Price continued the move down towards the 423.6% Fibonacci target, the S3 support of the current month and the long term 50% retrace since the up move that started in 2009. I expect a further move down the coming week(s). When this target is reached we must expect an up reaction.
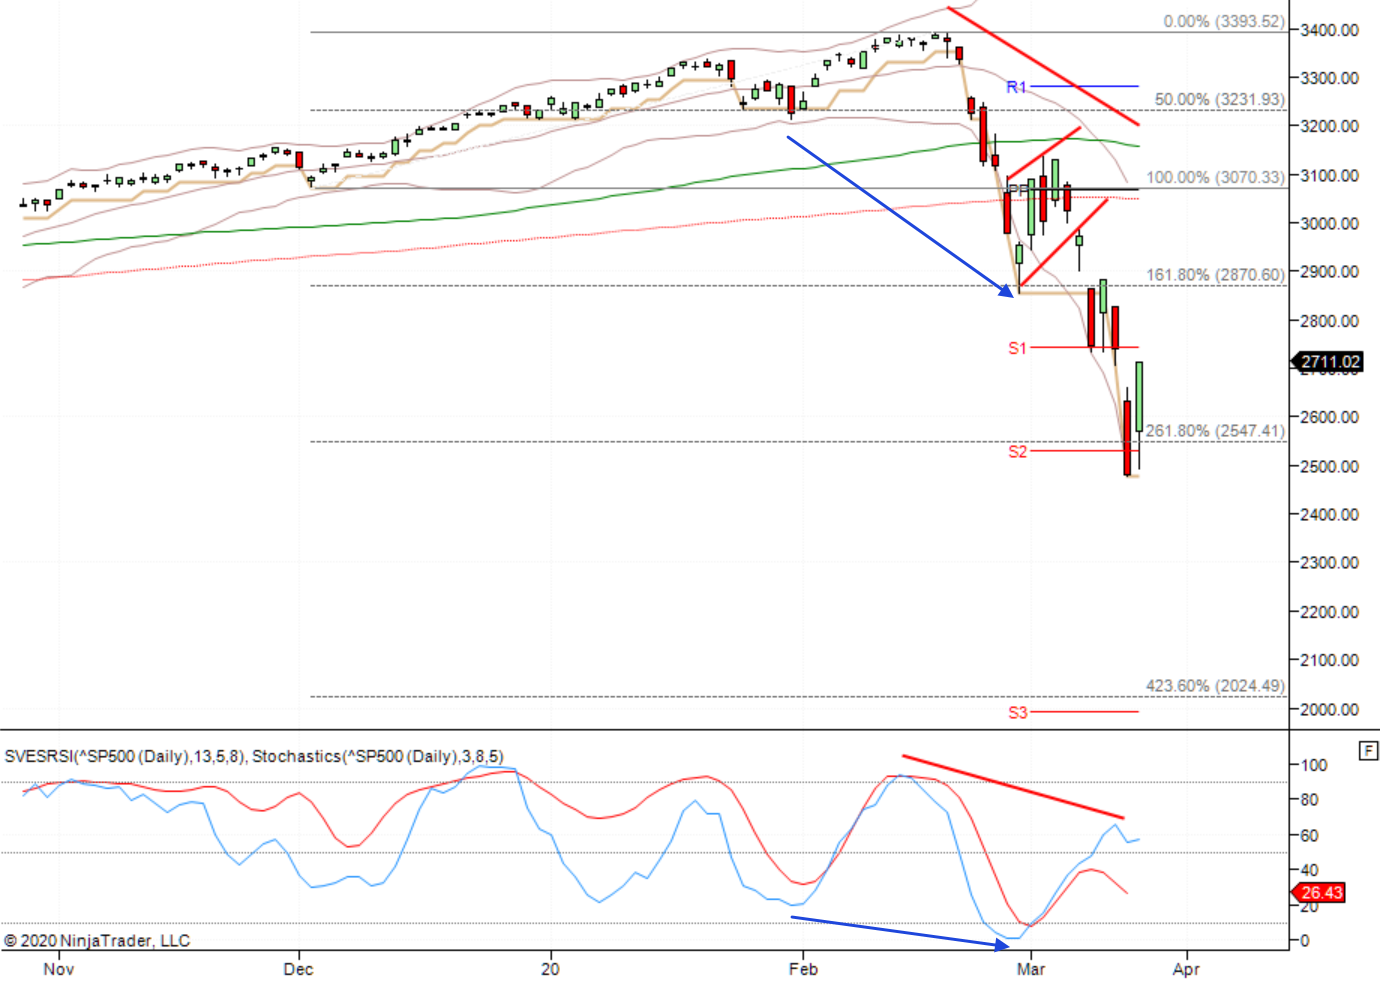
03/14/2020
Since I am very occupied with applying my V-Trade system, I will not update my comments on a weekly basis. However, I will try to make new comments when I note some important changes.
What is happening in the daily chart?
A very volatile move also in the daily chart with quite a number of gaps in the move down. There was a bottom convergence between the last bottom in the S&P500 up move and the first bottom in the down move (blue arrow). This mostly indicates the start of an up reaction but, will be followed by a further move down once the reaction completes. That happened in the form of a small up moving flag price pattern. I am using the last impulse wave up as a reference to draw the downward Fibonacci targets. The 161.8% target was reached and the up correction started. Continuing the move down after the up correction, price fell below the 161.9% target. Creating resistance the next day with a further down to the 261.8% target. The S2 pivot support together with the 261.8% Fibonacci support brought price back up to the S1 pivot support. With lower tops in price and indicator, we can expect a temporary up correction but, a further move down after the correction completion. The 423.6% Fibonacci target is at 2024. This is also the current S3 pivot support. So far the technical analysis!
Maybe you lost already too much money?
The in between up reactions will most probably not be large enough for you to decide to close your position(s). Hoping for a further up move, you will be tempted to stay in the trade during these reactions, getting hit again by the next move further down. This will bring you to the point closing your trades near the lowest point?
In this kind of situation you might try the following:
Take your loss and close whole or part of your position in the current up reaction.
Open short positions or buy some put options when the next move down starts.
Take profit near the start of the next up reaction.
Repeat this strategy using the daily chart until reaching the end of the down move.
Use technical analysis to project and find confirmations that the end of the move down is reached.
If you have a long term turning point try to make use of some leverage to open new long positions.
You will recover your previous loss in the first longer term up wave.
Using some trading expert system will certainly help you to react more confident both opening and closing trades.
Make sure the final decision to open or close trades is yours!
Read my updated comments for the weekly chart and monthly chart for more information regarding the longer term view.
NinjaTrader® charts courtesy of NINJATRADER®

S&P500
Analysis Charts: -Daily -Weekly -Monthly -Template -Formulas -SPY real time
STOCATA Stocks Technical Analysis HOME
Links
Find a Stock ticker symbol, enter the ticker and find a chart, news, fundamentals and historical quotes.
Risk Disclosure: Futures and forex trading contains substantial risk and is not for every investor. An investor could potentially lose all or more than the initial investment. Risk capital is money that can be lost without jeopardizing ones’ financial security or life style. Only risk capital should be used for trading and only those with sufficient risk capital should consider trading. Past performance is not necessarily indicative of future results.
Hypothetical Performance Disclosure: Hypothetical performance results have many inherent limitations, some of which are described below. no representation is being made that any account will or is likely to achieve profits or losses similar to those shown; in fact, there are frequently sharp differences between hypothetical performance results and the actual results subsequently achieved by any particular trading program. One of the limitations of hypothetical performance results is that they are generally prepared with the benefit of hindsight. In addition, hypothetical trading does not involve financial risk, and no hypothetical trading record can completely account for the impact of financial risk of actual trading. for example, the ability to withstand losses or to adhere to a particular trading program in spite of trading losses are material points which can also adversely affect actual trading results. There are numerous other factors related to the markets in general or to the implementation of any specific trading program which cannot be fully accounted for in the preparation of hypothetical performance results and all which can adversely affect trading results.
See more 'Legal Disclosures' in the bottom menu bar!