
Latest News
2022 Start working on a new website
BBS Trading Expert
Watch the Youtube BBS video and here is a crude oil trading example
Want to know more about:
AXIOM business books awards, bronze medal! Thank You!
No longer available!
Favorite articles in 2010, 11, 12, 14 and 2015 S&C Readers' Choice Awards.

AXIOM Business Books Awards, bronze medal.

S&P500 Analysis: -Daily -Weekly -Monthly -Template -Formulas -Real-Time - HOME
S&P500 Technical Analysis
Please look at all charts, monthly, weekly and daily before making your own conclusion. You can find HERE a description of the chart template used.
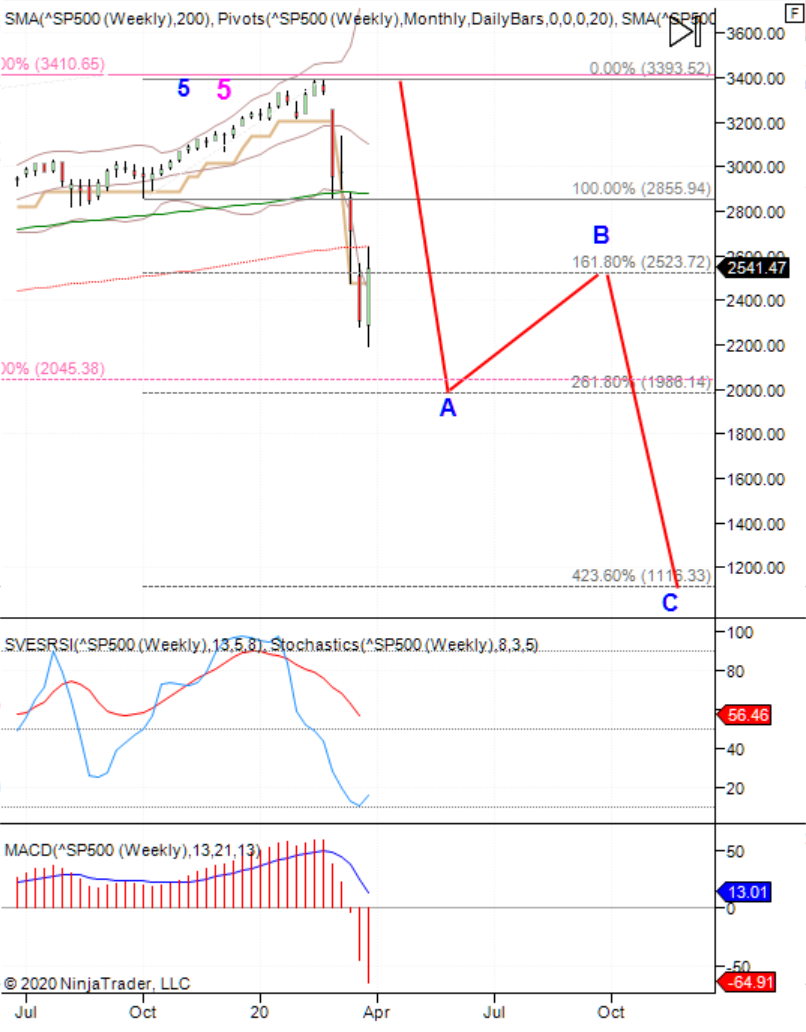
Weekly chart
03/28/2020:
In the weekly chart the index is moving down past the 161.8% Fibonacci retrace towards the 261.5% Fibonacci target and the 50% long term retrace since the move up started in 2009. At that point we must expect an up correction possibly up to the the low of the previous wave 4 or the 161.8% Fibonacci retrace or the 200 bars weekly average. From that point there is a chance that the down move will resume for a long term down target near 1200, finishing the ABC long term Elloitt wave.
NinjaTrader® charts courtesy of NINJATRADER®

S&P500 Analysis Charts: -Daily -Weekly -Monthly -Template -Formulas -SPY Real Time
STOCATA Stocks Technical Analysis HOME
Links
Find a Stock ticker symbol, enter the ticker and find a chart, news, fundamentals and historical quotes.
Risk Disclosure: Futures and forex trading contains substantial risk and is not for every investor. An investor could potentially lose all or more than the initial investment. Risk capital is money that can be lost without jeopardizing ones’ financial security or life style. Only risk capital should be used for trading and only those with sufficient risk capital should consider trading. Past performance is not necessarily indicative of future results.
Hypothetical Performance Disclosure: Hypothetical performance results have many inherent limitations, some of which are described below. no representation is being made that any account will or is likely to achieve profits or losses similar to those shown; in fact, there are frequently sharp differences between hypothetical performance results and the actual results subsequently achieved by any particular trading program. One of the limitations of hypothetical performance results is that they are generally prepared with the benefit of hindsight. In addition, hypothetical trading does not involve financial risk, and no hypothetical trading record can completely account for the impact of financial risk of actual trading. for example, the ability to withstand losses or to adhere to a particular trading program in spite of trading losses are material points which can also adversely affect actual trading results. There are numerous other factors related to the markets in general or to the implementation of any specific trading program which cannot be fully accounted for in the preparation of hypothetical performance results and all which can adversely affect trading results.
See more 'Legal Disclosures' in the bottom menu bar!