
Latest News
2022 Start working on a new website
BBS Trading Expert
Watch the Youtube BBS video and here is a crude oil trading example
Want to know more about:
AXIOM business books awards, bronze medal! Thank You!
No longer available!
Favorite articles in 2010, 11, 12, 14 and 2015 S&C Readers' Choice Awards.

AXIOM Business Books Awards, bronze medal.

STS8 Trading Method Introduction
STS8 or Stocata Swing Trading Stocks is a trading method based on 8 rules that must be complied with to open or close a trade. It uses a number of proprietary indicators. The STS8 method can be used to trade stocks futures and forex on an end of day or real time basis. There are eight clearly defined rules for making swing trading buy or sell decisions. These rules are applied to a customized chart template with a number of proprietary indicators. Some of the rules allow alternatives. One of the indicators is an expert system that can be used for full auto-trading. The charting program used is NinjaTrader V7, courtesy of NINJATRADER LLC. This program can be downloaded from: (http://www.ninjatrader.com/) . It can be used free of charge if you do not want to trade full automatic with your personal broker. End of day price data is also available free of charge. |
|
We will have a detailed look at each of the rules and the rules for opening a short trade and closing a trade. Inclusive a worked-out example trading the stock GT in a period from July 2010 till August 2011. A buy and hold strategy during this period gives a profit of about 40% while applying STS8 produces a profit of 300%. I wish you a lot of fun and Happy Trading!
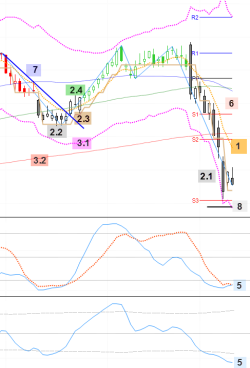
The STS8 template has a number of indicators in four different windows.
Main price chart window:
Open, high, low and closing prices are displayed as a standard candle chart. The candlesticks are color coded by an expert indicator for buy, sell and open short position signaling. However as with the basic candle coding an empty (white) body has a closing price above the opening price and a filled (colored) body has a closing price below the opening price.
Sub-window 1:
A proprietary stochastic RSI indicator (light blue) and a standard stochastic oscillator (dotted red).
Sub-window 2:
A proprietary %b oscillator based on the BBS (Band Break System) bands. More about the BBS system now available HERE.
Sub-window 3:
A standard RSI indicator (light blue) overlaid with an average (dotted red).
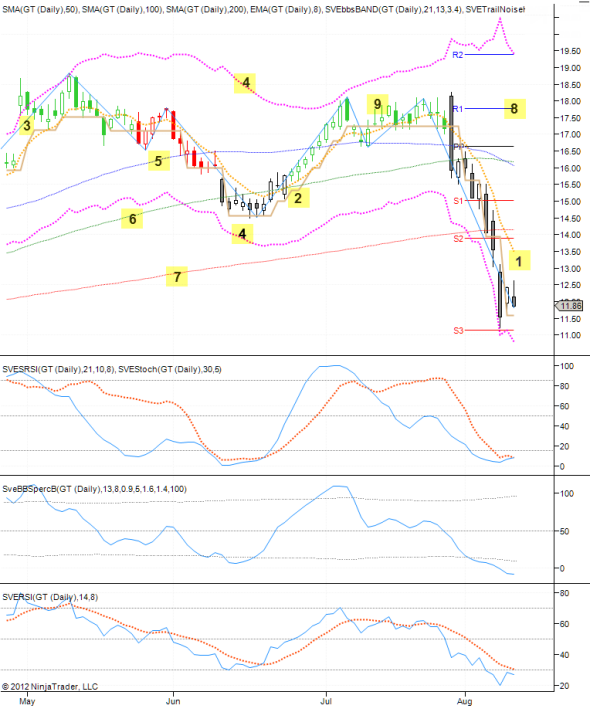
- An eight period exponential moving average (dotted orange).
- A proprietary trailing buy-sell noise indicator "SVETrailNoise" (brown staircase line). This indicator reverses direction when there is too much noise or price change.
- A proprietary indicator to assist you in counting waves "SVE123Count" (Light blue zigzag line). The basic rules behind and the application of this wave count system is explained HERE. This indicator shows a direction change after complying with a minimum reverse condition.
- The proprietary "SVEbbsBand" (purple dotted lines) upper and lower band is used to catch the up and down price moves within the bands.
- A standard 50 periods (days) simple moving average (blue small dotted line).
- A standard 100 periods (days) simple moving average (green small dotted line).
- A standard 200 periods (days) simple moving average (orange-red small dotted line). All of the standard averages will be used as active support and resistance levels.
- Pivot points "SVEPivots", PP, resistance R1 to R3 and support S1 to S3, calculated on a previous bar of a higher time frame. On a daily chart we use a monthly reference.
- The proprietary Price Range expert system "SVEPRExp" color codes the candles. Green for a long position, red (or black) for closing a long position and black for a short position with green closing the short position. This expert can be used for full auto-trading.
In the first sub-window there are 2 indicators. The first is a fast stochastic RSI "SVESRSI" (light blue) and the second a slow standard stochastic (dotted red).
The second sub-window is a %b indicator "SveBBSpercB" a %b indicator based on my BBS band deviation system.
Finally in the third sub-window there is a standard RSI indicator (light blue) with a simple moving average (dotted red).
For all the basic techniques, please consult my book “Capturing Profit with Technical Analysis”, published by MarketPlace Books and available HERE
STOCATA Stocks Technical Analysis HOME
Links
Find a Stock ticker symbol, enter the ticker and find a chart, news, fundamentals and historical quotes.
Risk Disclosure: Futures and forex trading contains substantial risk and is not for every investor. An investor could potentially lose all or more than the initial investment. Risk capital is money that can be lost without jeopardizing ones’ financial security or life style. Only risk capital should be used for trading and only those with sufficient risk capital should consider trading. Past performance is not necessarily indicative of future results.
Hypothetical Performance Disclosure: Hypothetical performance results have many inherent limitations, some of which are described below. no representation is being made that any account will or is likely to achieve profits or losses similar to those shown; in fact, there are frequently sharp differences between hypothetical performance results and the actual results subsequently achieved by any particular trading program. One of the limitations of hypothetical performance results is that they are generally prepared with the benefit of hindsight. In addition, hypothetical trading does not involve financial risk, and no hypothetical trading record can completely account for the impact of financial risk of actual trading. for example, the ability to withstand losses or to adhere to a particular trading program in spite of trading losses are material points which can also adversely affect actual trading results. There are numerous other factors related to the markets in general or to the implementation of any specific trading program which cannot be fully accounted for in the preparation of hypothetical performance results and all which can adversely affect trading results.
See more 'Legal Disclosures' in the bottom menu bar!