
Latest News
2022 Start working on a new website
BBS Trading Expert
Watch the Youtube BBS video and here is a crude oil trading example
Want to know more about:
AXIOM business books awards, bronze medal! Thank You!
No longer available!
Favorite articles in 2010, 11, 12, 14 and 2015 S&C Readers' Choice Awards.

AXIOM Business Books Awards, bronze medal.

STS8 Trading Rule 2
Rule 2.1 Candle chart reversal pattern
To comply with rule 2.1: "the last pivot point must be a candle chart reversal pattern".
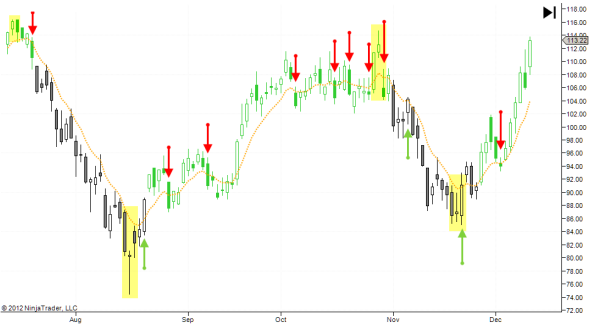
The green and red arrows in the following figure show all rule 1 compliance, the closing price breaks above/below the 8 day Exponential Moving Average.
Looking at each of these points and applying rule number 2.1, you can see that there are only 4 signals left (yellow marker), pinpointing the more important reversals.
From left to right we have a bearish engulfing pattern, a morning doji star, an evening star and a bullish confirmed harami followed by a bullish engulfing pattern. All other rule 1 breaks do not have a valid candlestick pattern before that.
Rule 2.2 Major or Confirmed support/Resistance
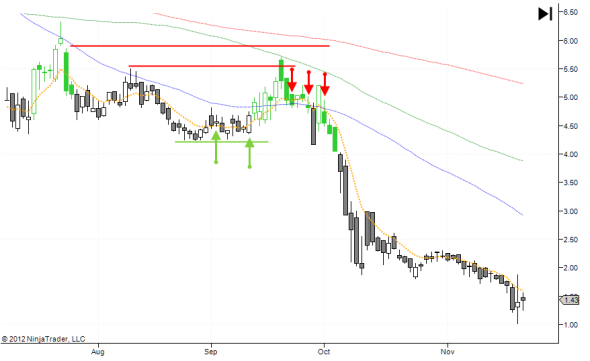
In the above figure you can see all averages moving down. The 50 period simple moving average (blue), the 100 (green) and the 200 (red). There is also resistance from a gap (upper red horizontal line) and resistance from a top in August (lower red line).
The first green up arrow is a buy signal from rule 1, but there is no valid candlestick reversal and there is only limited support from a previous bottom. The second green up arrow is another buy signal, again still no valid candlestick reversal, but double support already. If this signal is confirmed by all other rules, should you buy? If you buy here it must be clear that you are trading against the trend and that there is a lot of resistance nearby! You should expect a limited profit only and act fast.
The red arrows selling opportunities have no valid candlestick reversal pattern, but have main resistance from previous tops, the gap and the 100 and 200 period average. Personally I would not take the first one having a closing price just at the 50 average. I would take the second one where it also breaks that 50 average. If you did not take that one, then there is the third one that you should not miss.
Rule 2.3 Stop Trail Noise indicator changes direction
SVETrailNoise is an auto-switching trailing stop indicator. It is the brown stepwise moving indicator in the next figure.
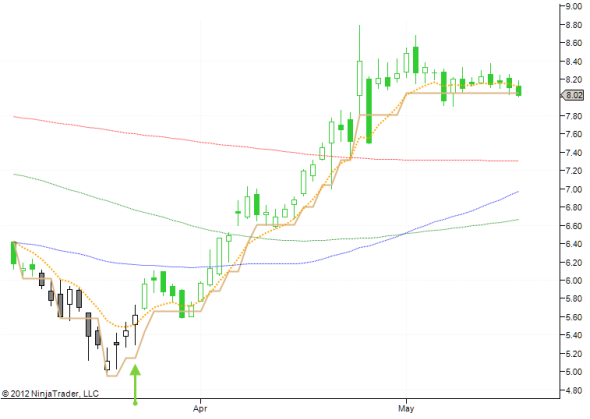
At the green up arrow we have a buy signal from rule 1. But we are not complying with rule 2.1, there is no valid candlestick up reversal pattern and we are not complying with the alternative rule 2.2, there is no major nor confirmed support.
Still we have a valid signal based on alternative rule 2.3. The SVETrailNoise indicator changed direction since the last low pivot from a down move to an up move.
Rule 2.4 Buy or Sell candle from Price range Expert
A final alternative for rule 2 is 2.4: "the Price range expert system displays a buy or sell candle". SVEPRExp is an expert indicator based on price range. It color codes the candles (next figure). Green for a buy long or close short signal. Red for a close long signal and black for an open short signal. A color filled candle body is a candle that closed below the opening price and a blank (white) candle body represents a closing price above the opening price. This indicator can be used as a profitable auto-trading system on itself!
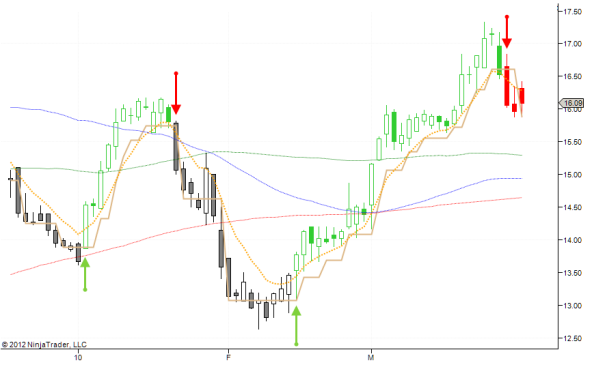
The first green up arrow is a buying signal from rule 1. There is no valid candlestick reversal (rule 2.1), but there is main support from the 200 bars average (rule 2.2). Additionally the candle is green making it complying with rule 2.4.
The first red candle is a selling signal from rule 1. There is no confirmation from rules 2.1, 2.2 nor 2.3. However we have a confirmation from rule 2.4 with a black candle. The same reasoning is valid for the second green up arrow. The second red arrow down also gives a confirmation with rule 2.4 with a red candle, but it is already confirmed with a valid candlestick top reversal pattern (evening doji star pattern).
It is clear that the more rules are confirmed in an OR function, the better!
For all the basic techniques, please consult my book “Capturing Profit with Technical Analysis”, published by MarketPlace Books and available HERE
STOCATA Stocks Technical Analysis HOME
Links
Find a Stock ticker symbol, enter the ticker and find a chart, news, fundamentals and historical quotes.
Risk Disclosure: Futures and forex trading contains substantial risk and is not for every investor. An investor could potentially lose all or more than the initial investment. Risk capital is money that can be lost without jeopardizing ones’ financial security or life style. Only risk capital should be used for trading and only those with sufficient risk capital should consider trading. Past performance is not necessarily indicative of future results.
Hypothetical Performance Disclosure: Hypothetical performance results have many inherent limitations, some of which are described below. no representation is being made that any account will or is likely to achieve profits or losses similar to those shown; in fact, there are frequently sharp differences between hypothetical performance results and the actual results subsequently achieved by any particular trading program. One of the limitations of hypothetical performance results is that they are generally prepared with the benefit of hindsight. In addition, hypothetical trading does not involve financial risk, and no hypothetical trading record can completely account for the impact of financial risk of actual trading. for example, the ability to withstand losses or to adhere to a particular trading program in spite of trading losses are material points which can also adversely affect actual trading results. There are numerous other factors related to the markets in general or to the implementation of any specific trading program which cannot be fully accounted for in the preparation of hypothetical performance results and all which can adversely affect trading results.
See more 'Legal Disclosures' in the bottom menu bar!