
Latest News
2022 Start working on a new website
BBS Trading Expert
Watch the Youtube BBS video and here is a crude oil trading example
Want to know more about:
AXIOM business books awards, bronze medal! Thank You!
No longer available!
Favorite articles in 2010, 11, 12, 14 and 2015 S&C Readers' Choice Awards.

AXIOM Business Books Awards, bronze medal.

STS8 Trading Rules
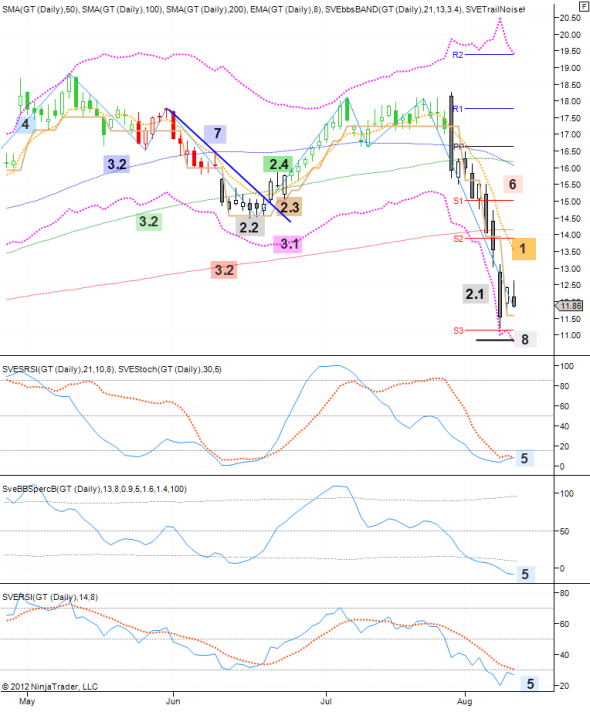
Rules for Opening a Long or Closing a short Position
- The closing price breaks above the 8 day Exponential Moving Average.
AND - 2.1 The last pivot is a candle chart bottom reversal pattern.
OR
2.2 There is major or confirmed price support.
OR
2.3 The Stop Trail Noise indicator starts moving up.
OR
2.4 The Price Range expert system displays a green buy candle.
AND - 3.1 The price is close to the low of the BBS band.
OR
3.2 The price is close to support of the 50/100/200 simple moving average.
AND - 4.1 You are expecting an up wave 3.
OR
4.2 A wave 2 up to become a wave 1after a series of 123-waves in a down move.
OR
4.3 A wave 2 up after a large previous wave 3 down.
AND - Indicators moving up from low levels preferably with positive divergence.
AND - Price is close to support or far from resistance.
AND - The closing price is breaking the last possible downtrend line.
AND - The stop loss setting to be used limits the risk to a maximum loss of 10% (long position on a daily chart).
Rule 1: Eight period exponential Moving average
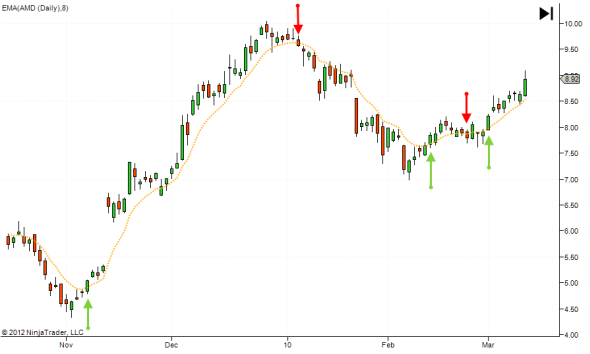
The first indicator used is an 8 period exponential moving average, the orange dotted line in figure 2.1. The 8 period used is a good performing fast average to detect crossovers with the closing price.
In a standard candle chart like the above figure, a green candle has a closing price above the opening price and a red candle has a closing price below the opening price. A cross above or below the average with a closing price complies to STS8 rule number 1: "the closing price breaks above/below the 8 day Exponential Moving Average".
The first green up arrow is an open buy (close short) signal. Closing prices remain above the average until the first red arrow down. This is a close long (open short) signal.
Now closing prices stay below the average until the second green arrow. We now have a close short (open long) signal. Soon after that we have a second red and green arrow.
This is a good starting rule, but of course not all trades are profitable, especially during flat price moves, the closing price will break the average a lot.
But this is just one STS8 rule. The other rules will help avoiding non profitable trades.
For all the basic techniques, please consult my book “Capturing Profit with Technical Analysis”, published by MarketPlace Books and available HERE
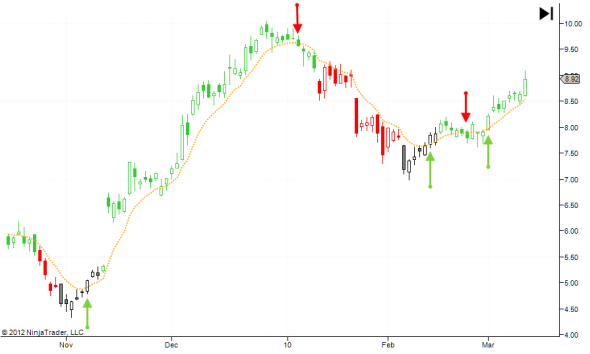
We will be color coding the candles by an expert system later on.
An unfilled (white) candle is a green candle in the previous figure (close>open) and a filled candle (green, red or black) is a red candle (close<open) in the previous figure.
We will use the expert color coded chart from here on.
STOCATA Stocks Technical Analysis HOME
Links
Find a Stock ticker symbol, enter the ticker and find a chart, news, fundamentals and historical quotes.
Risk Disclosure: Futures and forex trading contains substantial risk and is not for every investor. An investor could potentially lose all or more than the initial investment. Risk capital is money that can be lost without jeopardizing ones’ financial security or life style. Only risk capital should be used for trading and only those with sufficient risk capital should consider trading. Past performance is not necessarily indicative of future results.
Hypothetical Performance Disclosure: Hypothetical performance results have many inherent limitations, some of which are described below. no representation is being made that any account will or is likely to achieve profits or losses similar to those shown; in fact, there are frequently sharp differences between hypothetical performance results and the actual results subsequently achieved by any particular trading program. One of the limitations of hypothetical performance results is that they are generally prepared with the benefit of hindsight. In addition, hypothetical trading does not involve financial risk, and no hypothetical trading record can completely account for the impact of financial risk of actual trading. for example, the ability to withstand losses or to adhere to a particular trading program in spite of trading losses are material points which can also adversely affect actual trading results. There are numerous other factors related to the markets in general or to the implementation of any specific trading program which cannot be fully accounted for in the preparation of hypothetical performance results and all which can adversely affect trading results.
See more 'Legal Disclosures' in the bottom menu bar!