
Latest News
2022 Start working on a new website
BBS Trading Expert
Watch the Youtube BBS video and here is a crude oil trading example
Want to know more about:
AXIOM business books awards, bronze medal! Thank You!
No longer available!
Favorite articles in 2010, 11, 12, 14 and 2015 S&C Readers' Choice Awards.

AXIOM Business Books Awards, bronze medal.

Technical Analysis Averages
Moving averages are used to smooth short-term swings to get a better indication of the price trend. Averages are trend-following indicators. A moving average of daily prices is the average price of a share over a chosen period, displayed day by day.
- For calculating the average, you have to choose a time period.
- The choice of a time period is always a reflection upon, more or less lag in relation to price compared to a greater or smaller smoothing of the price data.
Price averages are used as trend following indicators and mainly as a reference for price support and resistance. In general averages are present in all kind of formulas to smooth data.
Special offer: "Capturing Profit with technical Analysis"
Simple Moving Average
A simple moving average is calculated by adding all prices within the chosen time period, divided by that time period. This way, each data value has the same weight in the average result.
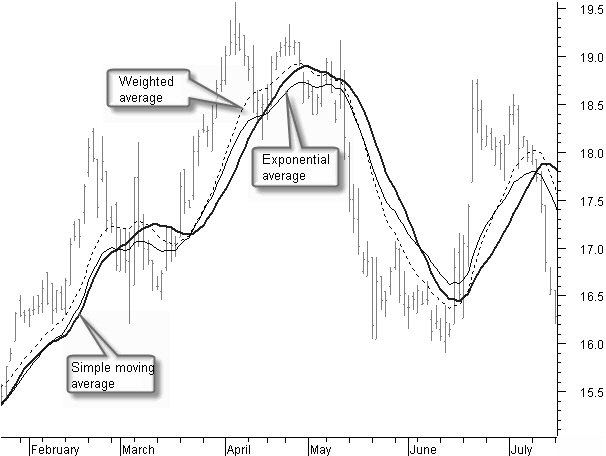
Figure 4.35: Simple, exponential and weighted moving average.
The thick, black curve in the chart of figure 4.35 is a 20-day simple moving average.
Exponential Moving Average
An exponential moving average gives more weight, percentage wise, to the individual prices in a range, based on the following formula:
EMA = (price * EMA %) + (previous EMA * (1 – EMA %))
Most investors do not feel comfortable with an expression related to percentage in the exponential moving average; rather, they feel better using a time period.
If you want know the percentage in which to work using a period, the next formula gives you the conversion:
![]()
A time period of three days corresponds to an exponential percentage of:
![]()
The thin, black curve in figure 4.35 is a 20-day exponential moving average.
Weighted Moving Average
A weighted moving average puts more weight on recent data and less weight on older data.
A weighted moving average is calculated by multiplying each data with a factor from day “1” till day “n” for the oldest to the most recent data; the result is divided by the total of all multiplying factors.
In a 10-day weighted moving average, there is 10 times more weight for the price today in proportion to the price 10 days ago. Likewise, the price of yesterday gets nine times more weight, and so on.
The thin, black dashed curve in figure 4.35 is a 20-day weighted moving average.
Simple, Exponential, or Weighted?
If we compare these three basic averages, we see that the simple average has the most smoothing, but generally also the biggest lag after price reversals.
The exponential average lies closer to the price and also will react faster to price swings. But shorter period corrections also are visible in this average because of a less smoothing effect.
Finally, the weighted average follows the price movement even more closely.
Determining which of these averages to use depends on your objective. If you want a trend indicator with better smoothing and only little reaction for shorter movements, the simple average is best.
If you want a smoothing where you can still see the short period swings, then either the exponential or weighted moving average is the better choice.
Technical Analysis Averages NEXT -Part 1 -Part 2 -Part 3 -Part 4
STOCATA Stocks Technical Analysis HOME
Links
Find a Stock ticker symbol, enter the ticker and find a chart, news, fundamentals and historical quotes.
Risk Disclosure: Futures and forex trading contains substantial risk and is not for every investor. An investor could potentially lose all or more than the initial investment. Risk capital is money that can be lost without jeopardizing ones’ financial security or life style. Only risk capital should be used for trading and only those with sufficient risk capital should consider trading. Past performance is not necessarily indicative of future results.
Hypothetical Performance Disclosure: Hypothetical performance results have many inherent limitations, some of which are described below. no representation is being made that any account will or is likely to achieve profits or losses similar to those shown; in fact, there are frequently sharp differences between hypothetical performance results and the actual results subsequently achieved by any particular trading program. One of the limitations of hypothetical performance results is that they are generally prepared with the benefit of hindsight. In addition, hypothetical trading does not involve financial risk, and no hypothetical trading record can completely account for the impact of financial risk of actual trading. for example, the ability to withstand losses or to adhere to a particular trading program in spite of trading losses are material points which can also adversely affect actual trading results. There are numerous other factors related to the markets in general or to the implementation of any specific trading program which cannot be fully accounted for in the preparation of hypothetical performance results and all which can adversely affect trading results.
See more 'Legal Disclosures' in the bottom menu bar!