
Latest News
2022 Start working on a new website
BBS Trading Expert
Watch the Youtube BBS video and here is a crude oil trading example
Want to know more about:
AXIOM business books awards, bronze medal! Thank You!
No longer available!
Favorite articles in 2010, 11, 12, 14 and 2015 S&C Readers' Choice Awards.

AXIOM Business Books Awards, bronze medal.

Technical Analysis Price Projections
Being able to make price projections is first of all important in relation with the risk/reward ratio. You simply cannot calculate the risk/reward ratio if you have no idea what price levels could be reached. On the other hand, knowing different techniques for estimating future price levels will be of great help deciding when to close a trade.
Special offer: "Capturing Profit with technical Analysis"
Basic price projections
Basic support and resistance will be found at price turning points and windows. More support levels will be found at the level of trendlines and trend channels as well as reaching reaction lines.
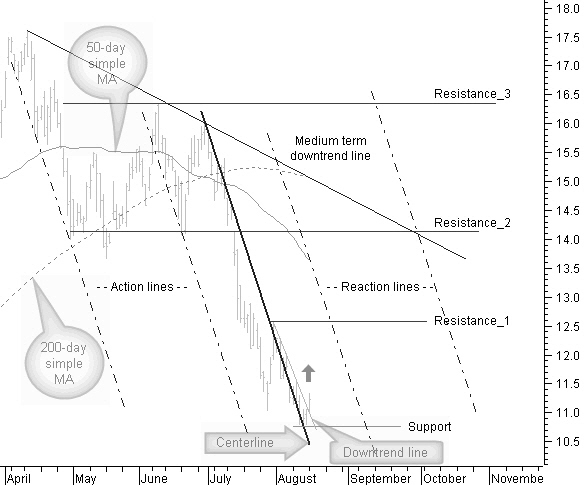
Figure 9.1: Basic support and resistance levels.
In figure 9.1 we have a buying signal after a big price move down when the closing price moves above a last downtrend line half of August. In case price would not move up further, there is only one important line and that is the support line. Generally also the initial stop level.
The first target price level is “Resistance_1”, a previous price reversal point. Next we expect some resistance from the 50-day simple moving average. Then follows “Resistance_2”, representing support levels and a window in the previous downtrend, previous support will become resistance. Probably around the same time there is resistance from the medium term downtrend line. Not far away from this level we will find resistance from the 200-day simple moving average.
Finally we have “Resistance_3” an important turning point in the previous downtrend. Close to this level are multiple turning points in the previous downtrend that will show resistance.
Drawing a centerline through the last big downtrend move, we can create some action lines (action-reaction lines will be discussed in the last part of this chapter) through past turning points where these previous downtrends show equal inclinations as the centerline. Projecting parallel lines into the future at the same distance as the action lines creates reaction lines. These reaction lines will also represent price resistance levels.
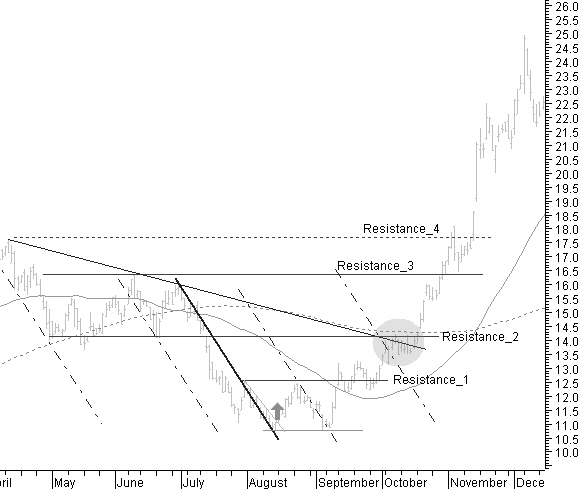
Figure 9.2: Future price move and the basic resistance levels.
In figure 9.2 you can see how the future price made a big up move. As expected there was a first resistance at the level of “Resistance_1” together with reaching the first reaction line, pushing price back down to the start of the up move. Also the next attack took some time to break that resistance for a move up to the next resistance. There was however support from the 50-day simple moving average.
At the level of “Resistance_2” there are more forces posing resistance. There is of course “Resistance_2” a previous support level in the downtrend now acting as resistance, there is resistance from the downtrend line, there is also resistance from the 200-day simple moving average and some resistance from the second reaction line.
On the further move up there is only slight resistance from the levels “Resistance_3” and “Resistance_4”. Resistance_3”, a previous resistance level in the downtrend turned to a support level for the further uptrend.
Technical Analysis Price Projections Next -Part 1 -Part 2 -Part 3 -Part 4
STOCATA Stocks Technical Analysis HOME
Links
Find a Stock ticker symbol, enter the ticker and find a chart, news, fundamentals and historical quotes.
Risk Disclosure: Futures and forex trading contains substantial risk and is not for every investor. An investor could potentially lose all or more than the initial investment. Risk capital is money that can be lost without jeopardizing ones’ financial security or life style. Only risk capital should be used for trading and only those with sufficient risk capital should consider trading. Past performance is not necessarily indicative of future results.
Hypothetical Performance Disclosure: Hypothetical performance results have many inherent limitations, some of which are described below. no representation is being made that any account will or is likely to achieve profits or losses similar to those shown; in fact, there are frequently sharp differences between hypothetical performance results and the actual results subsequently achieved by any particular trading program. One of the limitations of hypothetical performance results is that they are generally prepared with the benefit of hindsight. In addition, hypothetical trading does not involve financial risk, and no hypothetical trading record can completely account for the impact of financial risk of actual trading. for example, the ability to withstand losses or to adhere to a particular trading program in spite of trading losses are material points which can also adversely affect actual trading results. There are numerous other factors related to the markets in general or to the implementation of any specific trading program which cannot be fully accounted for in the preparation of hypothetical performance results and all which can adversely affect trading results.
See more 'Legal Disclosures' in the bottom menu bar!