
Latest News
2022 Start working on a new website
BBS Trading Expert
Watch the Youtube BBS video and here is a crude oil trading example
Want to know more about:
AXIOM business books awards, bronze medal! Thank You!
No longer available!
Favorite articles in 2010, 11, 12, 14 and 2015 S&C Readers' Choice Awards.

AXIOM Business Books Awards, bronze medal.

Stock Market Proprietary Indicators
SVAPO –
Short term Volume and Price Oscillator
SVAPO is my homemade indicator, which we are going to study in detail here.
VAPO is an important oscillator indicating short term reversal points to enter or exit trades. To trade based on SVAPO; we will also introduce an ATR (Average True range) trailing stop.
Before describing the construction and application of the short-term volume and price oscillator (SVAPO), I’ll discuss some basics using an indicator as a buy and sell trigger.
Special offer: "Capturing Profit with technical Analysis"
The indicator must have clear reversal points and be as fast as possible on the entry side. The faster you can get in at a price reversal, the tighter your initial stop-loss can be. This will save you a lot of money on those trades that move the wrong way.
A trailing stop-loss, which is a stop-loss order that follows the prevailing price trend, is best set in relation to your investment horizon. Are you a swing trader trying to catch all the shorter profitable price moves, or are you a medium- to long-term trader trying to stay in the trade to capture the extended bigger price moves?
Oscillator and Price Relation
There is no ideal indicator, which is why you have to protect your investment with a stop order.
Using a single oscillator as the only reference to enter or exit a trade is not a good idea. The oscillator should instead be used as an alert for having a closer look at the chart and only then make a decision, taking into consideration all possible technical analysis tools.
The Perfect Pair
Now and then the oscillator you use is perfect.
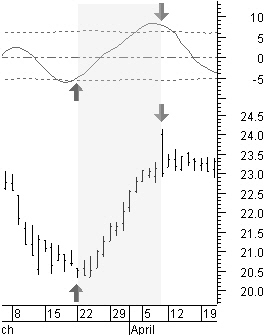
Figure 8.1, the daily chart of NCR Corp. (NCR), shows an ideal relation between the oscillator at the top of the chart and the price at the bottom.
A buy signal is given when the oscillator reaches the lower boundary and turns up.
A sell signal is given when the oscillator is at the upper boundary and turns down.
The oscillator here is as fast as it can be and marks the exact top and bottom turning points.
Figure 8.1: NCR daily an ideal relation between the oscillator and price.
Initial Stop
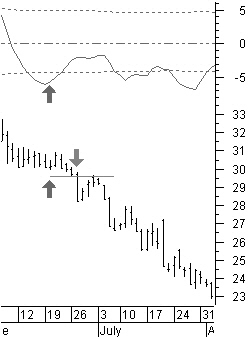
Figure 8.2 illustrates a less-perfect scenario with the daily chart of eBay Inc. (EBAY), but it is saved by the initial stop.
A buy signal is generated when the oscillator turns up from below the lower boundary. An appropriate initial stop related to the price volatility and with no previous low available is set at 2% from the buying price.
The price moves down farther, and we are stopped out of the trade five days later with a minimum loss, thanks to the initial stop.
Figure 8.2: EBAY much less perfect but saved by the initial stop.
Trailing Stop
In addition to staying in a trade for a longer period of time with the longer price moves, the trailing stop also will be handy when the oscillator is not giving a sell signal. This tends to occur when the price is moving flat or consolidating in a downtrend.
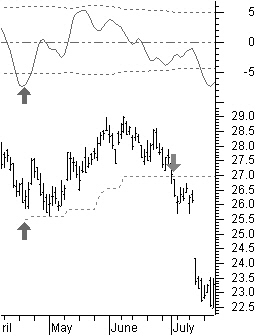
Take a look at figure 8.3 with the chart of Intel Corp (INTC).
The initial stop was set tight at 3%, below the short-term low. A normal medium-term 7% stop is used as a trailing stop.
The oscillator does not pass the upper boundary and, as a result, it does not create a sell signal.
Still, the trade could be closed without a loss, thanks to the trailing stop that got you out of the trade just in time.
Figure 8.3: Intel initial stop at 3% and a medium-term7% trailing stop.
SVAPO Construction
Basic Assumptions
In order to construct a short-term oscillator based on price and volume, you have to look at the relationship between these two components in up-trending and down-trending markets.
These are their normal relationships:
Up-trending market |
Price |
Volume |
|
|
|
Uptrend |
Up |
Up |
Correction |
Down |
Down |
Reversal |
Down |
Up |
Down-trending market |
Price |
Volume |
|
|
|
Uptrend |
Down |
Up |
Correction |
Up |
Down |
Reversal |
Up |
Up |
Combining the relationships based on market direction leaves us with three possible conditions:
Market direction |
Price |
Volume |
Calculation |
|
|
|
|
Uptrend |
Up |
Up |
+ Volume |
Downtrend |
Down |
Up |
- Volume |
Corrections |
Up/Down |
Down |
0 |
In an up-trending market, the price and the volume are moving up. When calculating the oscillator, volume will be added.
In a down-trending market, the price goes down, while the volume is up. When calculating the oscillator, volume will be subtracted.
When the volume is moving down and the price is in a consolidation phase moving in either direction, the volume will not be taken into consideration when calculating the oscillator.
Merely combining price and volume will result in a very choppy oscillator. Using conventional smoothing techniques, such as moving averages, will create an unacceptable delay for a short-term oscillator. So, how can we remedy this for price and volume?
Proprietary Technical Indicators Next -Part 1 -Part 2 -Part 3 -Part 4 -Part 5
STOCATA Stocks Technical Analysis HOME
Links
Find a Stock ticker symbol, enter the ticker and find a chart, news, fundamentals and historical quotes.
Risk Disclosure: Futures and forex trading contains substantial risk and is not for every investor. An investor could potentially lose all or more than the initial investment. Risk capital is money that can be lost without jeopardizing ones’ financial security or life style. Only risk capital should be used for trading and only those with sufficient risk capital should consider trading. Past performance is not necessarily indicative of future results.
Hypothetical Performance Disclosure: Hypothetical performance results have many inherent limitations, some of which are described below. no representation is being made that any account will or is likely to achieve profits or losses similar to those shown; in fact, there are frequently sharp differences between hypothetical performance results and the actual results subsequently achieved by any particular trading program. One of the limitations of hypothetical performance results is that they are generally prepared with the benefit of hindsight. In addition, hypothetical trading does not involve financial risk, and no hypothetical trading record can completely account for the impact of financial risk of actual trading. for example, the ability to withstand losses or to adhere to a particular trading program in spite of trading losses are material points which can also adversely affect actual trading results. There are numerous other factors related to the markets in general or to the implementation of any specific trading program which cannot be fully accounted for in the preparation of hypothetical performance results and all which can adversely affect trading results.
See more 'Legal Disclosures' in the bottom menu bar!