
Latest News
2022 Start working on a new website
BBS Trading Expert
Watch the Youtube BBS video and here is a crude oil trading example
Want to know more about:
AXIOM business books awards, bronze medal! Thank You!
No longer available!
Favorite articles in 2010, 11, 12, 14 and 2015 S&C Readers' Choice Awards.

AXIOM Business Books Awards, bronze medal.

Technical Analysis of the EUR/USD pair
This page will be updated regularly with up-to-date monthly, weekly and daily charts. You can find HERE a description of the chart template used.
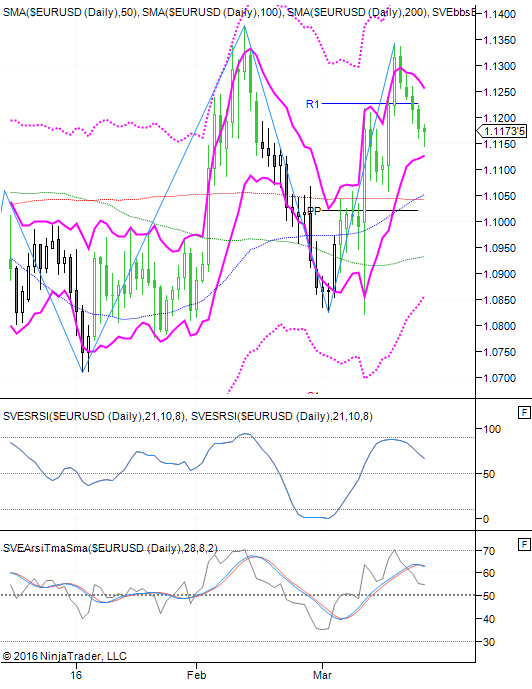
Daily Chart
More about the chart template and trading rules HERE.
February 27, 2016: Last week I wrote: "As expected we got a pullback the past week. There may be a little more correction, but I do expect a further move up towards the 1.16 level. A hidden divergence is coming up and will normally push the Euro to a higher level."
We got some more downward correction to the level of the R1 pivot support and the 100 and 200 day average. The hidden divergence between price and the indicator will possibly reverse the short term price move.
My SVEPRExp expert is green. More information about this expert system HERE and HERE.
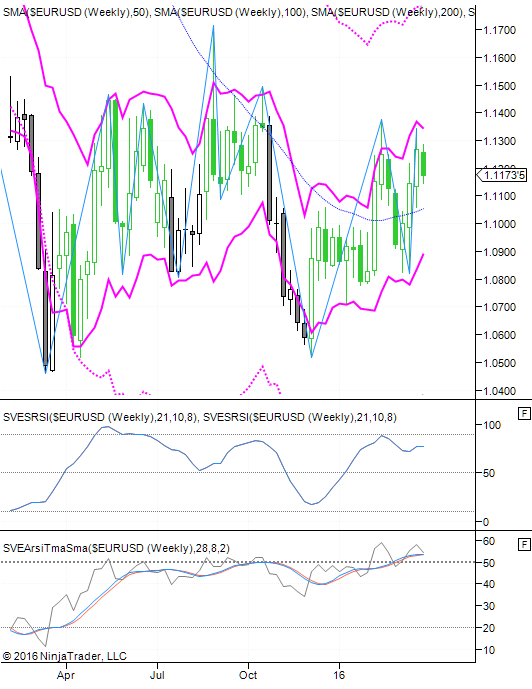
Weekly Chart
February 27, 2016: Last week I wrote: "Some retracement the past week, but we should expect a further move up, possibly after some more retracement."
Weekly it does not look very good. The some more retracement I mentioned last week is larger than expected with the creation of a hidden divergent move. This will probably push the Euro further down the coming week to the low side of the BBS band or even lower.
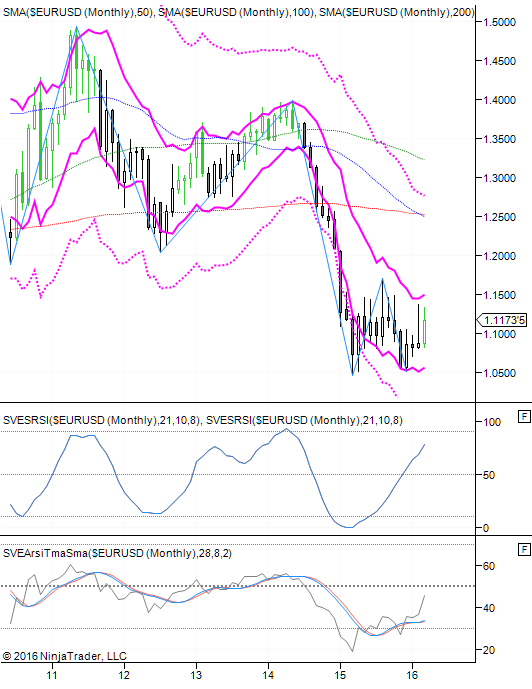
Monthly Chart
March 1, 2016:
Last month I wrote: "It looks like the expected up move towards the upper side of the BBS channel has started. There is room for a continuation of the move up, probably up to the price resistance around 1.20."
The high of February came very close to the expected upper side of the BBS channel, but lost most of the up move by the end of the month. My opinion there is room for another attempt to bring price higher towards the 1.20 I mentioned last month.
The long term SVEPRExp expert is black for a long term short position (Chart is updated until 02/27/2016).
Links
Find a Stock ticker symbol, enter the ticker and find a chart, news, fundamentals and historical quotes.
Risk Disclosure: Futures and forex trading contains substantial risk and is not for every investor. An investor could potentially lose all or more than the initial investment. Risk capital is money that can be lost without jeopardizing ones’ financial security or life style. Only risk capital should be used for trading and only those with sufficient risk capital should consider trading. Past performance is not necessarily indicative of future results.
Hypothetical Performance Disclosure: Hypothetical performance results have many inherent limitations, some of which are described below. no representation is being made that any account will or is likely to achieve profits or losses similar to those shown; in fact, there are frequently sharp differences between hypothetical performance results and the actual results subsequently achieved by any particular trading program. One of the limitations of hypothetical performance results is that they are generally prepared with the benefit of hindsight. In addition, hypothetical trading does not involve financial risk, and no hypothetical trading record can completely account for the impact of financial risk of actual trading. for example, the ability to withstand losses or to adhere to a particular trading program in spite of trading losses are material points which can also adversely affect actual trading results. There are numerous other factors related to the markets in general or to the implementation of any specific trading program which cannot be fully accounted for in the preparation of hypothetical performance results and all which can adversely affect trading results.
See more 'Legal Disclosures' in the bottom menu bar!