
Latest News
2022 Start working on a new website
BBS Trading Expert
Watch the Youtube BBS video and here is a crude oil trading example
Want to know more about:
AXIOM business books awards, bronze medal! Thank You!
No longer available!
Favorite articles in 2010, 11, 12, 14 and 2015 S&C Readers' Choice Awards.

AXIOM Business Books Awards, bronze medal.

Complementing Trading Techniques Part 2
A more certain bottom reversal
Correction wave C is an impulse wave. However in an individual stock not always easy recognized. But mostly there will be a number of waves down with each time a lower low in price.
Most certain about a bottom reversal we are when there is no lower bottom anymore. That is why it is best to wait until the last bottom since the medium term down trend, makes a higher low, before opening a position.
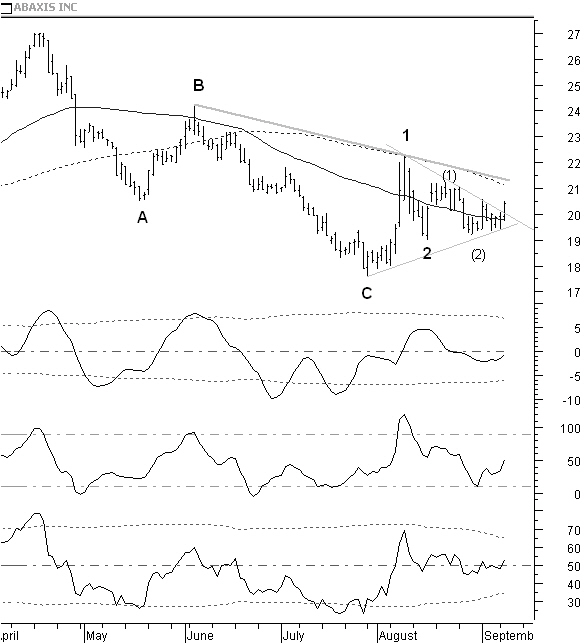
Figure 3.2: Abaxis daily, a more certain bottom reversal; opening a long position
In the daily chart of figure 3.2, the closing price moves above the short term descending trend line on September 11, 2007. It seems that wave C was already completed. The short term bottoms of waves 2 and (2) have higher lows and are probably the start of a longer term wave 3. Price is also breaking out of a triangle pattern. All the indicators now converge with the price move.
If price remains above the uptrend line of the rare triangle reversal pattern, we can use a close stop value of less than 5%. So, the risk is much more limited now.
Special offer: "Capturing Profit with technical Analysis"
Against buying now, there is the very close resistance of the 100-days simple moving average. We could wait for breaking this resistance, but most probably there will be the disadvantage of a worse risk/reward ratio. Personally I would go for opening a long position now at a closing price of $20.41, keeping a stop above the uptrend line and a trailing stop of 10%.
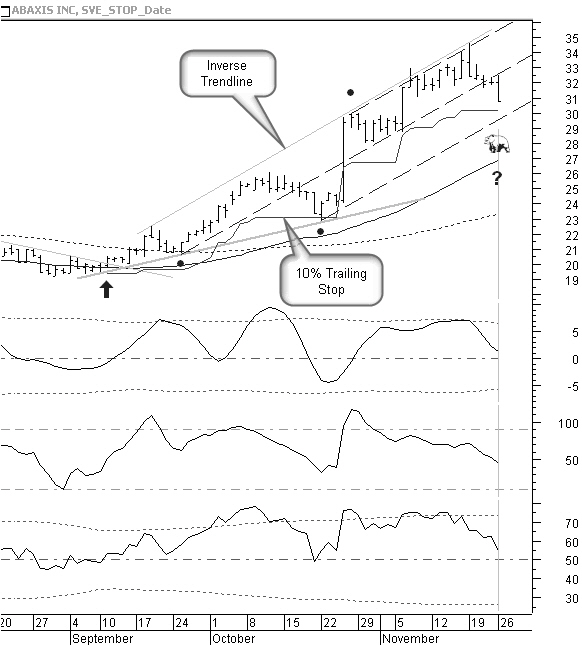
Figure 3.3: Abaxis daily, sell now or hold on to the long position?
Time moves fast, we are now November 26 2007. Look at figure 3.3 how price moved up slowly and from the beginning of October it fell back to the uptrend line while the closing price remained above the 10% trailing stop. There was no divergence visible in the indicators. Price next accelerated continuing the up trend.
Looking at the indicators, we are now at a point where we can ask ourselves if this would be a good time to sell. All three indicators are diverging and a further move down to the 50-days moving average is most likely.
On the other hand, looking at all the available support, it is probably worthwhile and justifiable to hold on to the position for the moment.
The lower side of the pitchfork based on the turning points indicated by the three dots, is close and will give support. We can draw an inverse trend line through a number of previous price tops. A parallel line with this inverse trend line through the October low point, gives an uptrend line that falls exactly together with the lower line of the pitchfork channel. These trend lines make up a trend channel. The lower side of this channel gives support. You can also see that these trend lines are perfectly in line with the 50-days moving average slope. Price is also just a fraction away from the 10% trailing stop level. These are more than enough good reasons to hold on to the position and forget about the indicators for the moment.
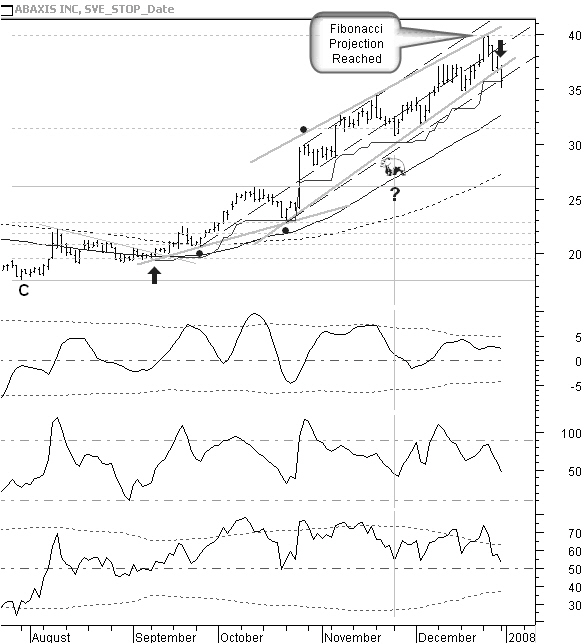
Figure 3.4: Abaxis daily, reversal signals; closing the long position.
And yes, looking at figure 3.4, price keeps moving up!
December 31, 2007:
- We have short and medium term divergences in the indicators.
- The last top was made at the level of a Fibonacci target.
- Price is falling through the uptrend line.
- Price is falling out of an up moving wedge pattern, possibly a top reversal pattern. It is probably also an Elliott ending wedge impulse wave.
- Price falls out of the up moving pitchfork.
- Price is very close to the trailing stop.
- Opening the position at $20.41 and a closing price now of $35.86, gives a 75% profit. Certainly another very solid reason to close the position now.
We close the long position.
Should we open a short position now?
Not if we want to be more certain that we really are at a medium term top level. We can never exclude that price will continue the up move after a correction.
A more certain top reversal
Nex we look at a more certain top reversal example.
Read the rest about trend reversal and trend continuation in the "Capturing Profit with Technical Analysis" book...
But there is more! We also look at some profitable special moving average crossovers and how we can insure our investment from the moment of buying.
Look for these chapters in the "Capturing Profit with Technical Analysis" book.
LOCKIT Complementing Trading Techniques Previous -Part 1 -Part 2
STOCATA Stocks Technical Analysis HOME
Links
Find a Stock ticker symbol, enter the ticker and find a chart, news, fundamentals and historical quotes.
Risk Disclosure: Futures and forex trading contains substantial risk and is not for every investor. An investor could potentially lose all or more than the initial investment. Risk capital is money that can be lost without jeopardizing ones’ financial security or life style. Only risk capital should be used for trading and only those with sufficient risk capital should consider trading. Past performance is not necessarily indicative of future results.
Hypothetical Performance Disclosure: Hypothetical performance results have many inherent limitations, some of which are described below. no representation is being made that any account will or is likely to achieve profits or losses similar to those shown; in fact, there are frequently sharp differences between hypothetical performance results and the actual results subsequently achieved by any particular trading program. One of the limitations of hypothetical performance results is that they are generally prepared with the benefit of hindsight. In addition, hypothetical trading does not involve financial risk, and no hypothetical trading record can completely account for the impact of financial risk of actual trading. for example, the ability to withstand losses or to adhere to a particular trading program in spite of trading losses are material points which can also adversely affect actual trading results. There are numerous other factors related to the markets in general or to the implementation of any specific trading program which cannot be fully accounted for in the preparation of hypothetical performance results and all which can adversely affect trading results.
See more 'Legal Disclosures' in the bottom menu bar!