
Latest News
2022 Start working on a new website
BBS Trading Expert
Watch the Youtube BBS video and here is a crude oil trading example
Want to know more about:
AXIOM business books awards, bronze medal! Thank You!
No longer available!
Favorite articles in 2010, 11, 12, 14 and 2015 S&C Readers' Choice Awards.

AXIOM Business Books Awards, bronze medal.

LOCKIT Application Example Part 4
01/12/2007: We have without any doubt a wave 5 extension.
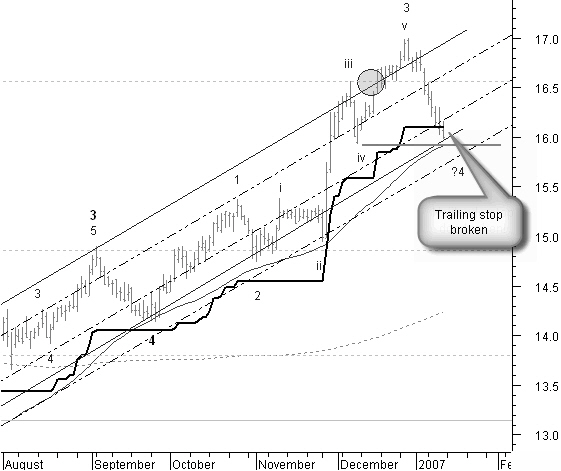
Figure 2.10: CMS daily, we have a wave 5 extension and now trailing stop is broken.
In figure 2.10, correction wave 2 remained above our trailing stop level. Price went through the third Fibonacci target and made a higher top than the previous long term wave 3 top. We may now be at the long term wave 5 top. If this is the case then our actual Elliott count does not fit. Our count is at a wave 4 correction. So, we expect wave 5 above the top of intermediate wave 3 or above $17.0.
But, this wave 4 is now breaking the trailing stop. Shall we close or wait one more day?
Special offer: "Capturing Profit with technical Analysis"
There is solid support from the 50-days simple moving average, support from the lower side of the trend channel and the pitchfork and from a support line of a previous low.
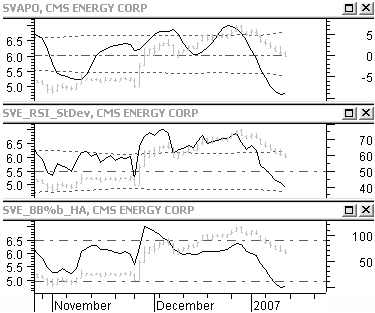
Figure 2.11: CMS daily, all indicators are in oversold territory.
Furthermore figure 2.11 shows that all indicators are in the oversold area. SVAPO en SVE_Bb%b_HA are already reversing. Good arguments to just put things on hold. However, we keep a stop at $15.8, just below the previous price support line or just a fraction below our trailing stop.
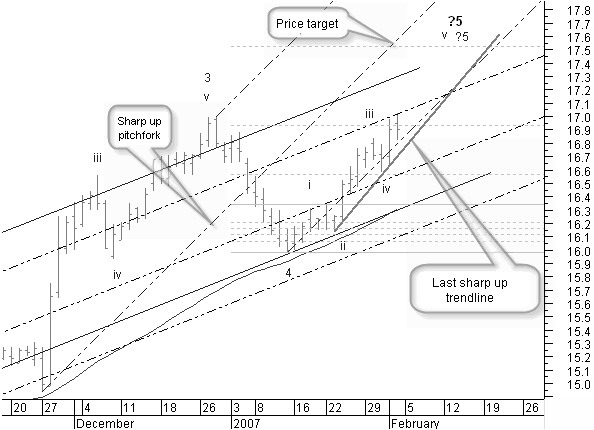
Figure 2.12: CMS daily, looking for the selling point.
02/02/2007: Our temporary stop at $15.8 was obsolete, price reversed immediately as you can see in figure 2.12.
If price moves further up past previous tops now, all waves 5 will come to an end. Best thing to do is to estimate a price target and close the position at this target, even considering that the last wave “v” could have another extension. Taking profit is the better thing to do. Another extension is unsure.
We have a few choices for closing the position.
- A first choice is reaching the first Fibonacci target at $17.5 from the projection over wave “i”.
- A second possibility is closing the trade based on reaching the median line of the new sharp up pitchfork which is clearly giving direction to the latest price move.
- A third possibility is not really aimed at a price target, but giving away as little as possible of the profit from a top turning point. That would mean selling when the last sharp uptrend line is broken.
Just avoiding having to make a choice, we will trade right on the first possibility that is presented!
Closing sell
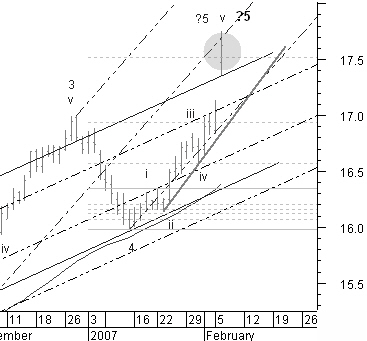
Figure 2.13: CMS daily, closing the long position.
02/06/2007: Oops, that was really fast!
Look how price reaches the third Fibonacci target and the median line of the pitchfork in figure 2.13.
We sell at a closing price of $17.63 minus the buying price of $12.52 makes a profit of $5.11 times 99 shares or a total profit of $505.89.
Now we have a total capital of $1,755.89 for the next trade in this stock.
We made a 40% profit
Short position .
02/26/2007: The day after closing our position there was a big volatile one day move.
Look for the following trades in the "Capturing Profit with Technical Analysis" book and see how we made a profit of 67% on the starting capital in about a year's time.
LOCKIT Stock Trading Example Previous -Part 1 -Part 2 -Part 3 -Part 4
STOCATA Stocks Technical Analysis HOME
Links
Find a Stock ticker symbol, enter the ticker and find a chart, news, fundamentals and historical quotes.
Risk Disclosure: Futures and forex trading contains substantial risk and is not for every investor. An investor could potentially lose all or more than the initial investment. Risk capital is money that can be lost without jeopardizing ones’ financial security or life style. Only risk capital should be used for trading and only those with sufficient risk capital should consider trading. Past performance is not necessarily indicative of future results.
Hypothetical Performance Disclosure: Hypothetical performance results have many inherent limitations, some of which are described below. no representation is being made that any account will or is likely to achieve profits or losses similar to those shown; in fact, there are frequently sharp differences between hypothetical performance results and the actual results subsequently achieved by any particular trading program. One of the limitations of hypothetical performance results is that they are generally prepared with the benefit of hindsight. In addition, hypothetical trading does not involve financial risk, and no hypothetical trading record can completely account for the impact of financial risk of actual trading. for example, the ability to withstand losses or to adhere to a particular trading program in spite of trading losses are material points which can also adversely affect actual trading results. There are numerous other factors related to the markets in general or to the implementation of any specific trading program which cannot be fully accounted for in the preparation of hypothetical performance results and all which can adversely affect trading results.
See more 'Legal Disclosures' in the bottom menu bar!