
Latest News
2022 Start working on a new website
BBS Trading Expert
Watch the Youtube BBS video and here is a crude oil trading example
Want to know more about:
AXIOM business books awards, bronze medal! Thank You!
No longer available!
Favorite articles in 2010, 11, 12, 14 and 2015 S&C Readers' Choice Awards.

AXIOM Business Books Awards, bronze medal.

Technical Analysis Candlestick charts Part2
Candlesticks Reveal More
When comparing the commonly used bar charts in Western technical analysis to the Eastern candle charts, it is evident that candle charts have a bigger visual impact.
Special offer: "Capturing Profit with technical Analysis"
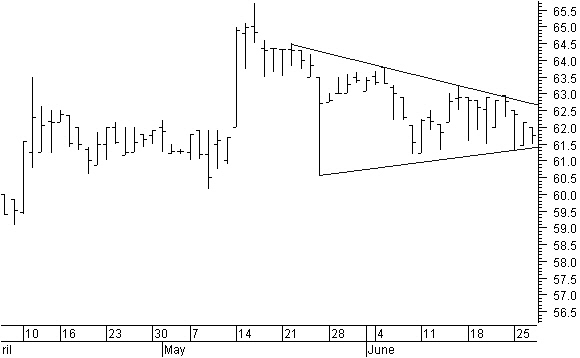
Figure 6.11: A bar chart has limited information.
Note the triangle formation in the bar chart of figure 6.11. A triangle formation often is a continuation pattern, but sometimes it can be a reversal pattern. The bar chart does not give any clue about which side of the triangle pattern will be broken.
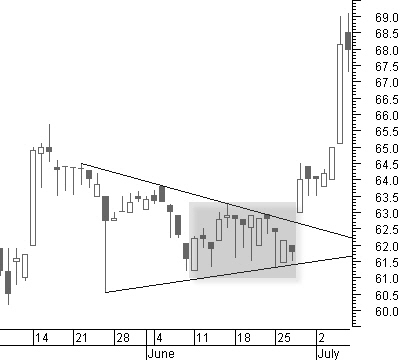
Figure 6.12: The candle chart tells you more.
But in the candle chart in figure 6.12, you see only candles with rising power in the last couple of weeks. The break to the upper side was, therefore, no big surprise, and you got a continuation of the uptrend.
Basic Patterns
Different basic patterns offer an indication about what kind of price evolution can be expected.
Basic Definitions
White Body
|
The closing price closed higher than the opening price. The white body has a normal average size compared to recent prices. |
|
Black Body
|
The closing price closed below the opening price. The black body has a normal average size compared to recent prices. |
|
Big White Candle
|
Rare. A long white body with little or no shadows compared to recent prices. High price and closing price are close together, and low price and opening price are also close together. A stronger rising pattern. If there is no other support nearby, you can use the midpoint of the white body as a support level. |
|
Big Black Candle
|
Rare. A long black body with little or no shadows compared to recent prices. High price and opening price are close together, and low price and closing price are also close together. A stronger falling pattern. If there is no other resistance nearby, you can use the midpoint of the black body as a resistance level. |
|
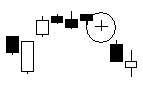
Doji
|
Opening price and closing price are very close together with upper and lower shadows. Doji’s are part of many candlestick patterns. A doji with bigger shadows is more important. |
|
- A doji in an up-move with a closing price below the previous closing price is a strong reversal indication.
- A doji in an up-move with a closing price above the previous closing price needs confirmation for a reversal.
- A doji or any other reversal pattern followed by a candle with a window mostly is a sure reversal indication.
- There is extra pressure on the market when more doji’s appear together.
- A doji in a downtrend has much less value than a doji in an uptrend. A doji in a downtrend always needs confirmation as a reversal signal.
- A doji during a flat, neutral trading period has no meaning.
- A doji or any other candle pattern confirms existing support or resistance.
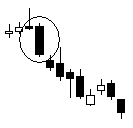
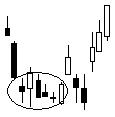
Long-legged Doji
|
A doji with big upper and lower shadows is also called a big wave doji. A warning signal for a reversal. This is an indication of big uncertainty in the market. |
|

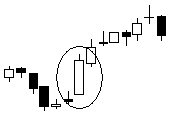
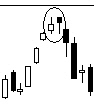
Doji Star
|
A doji above a white candle in an up-move or below a black candle in a down-move. A reversal signal, to be confirmed by the next candle to become an evening doji star or a morning doji star. |
|
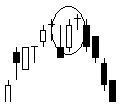
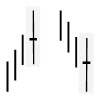
Spinning Tops and Bottoms
|
Spinning tops and bottoms are very common in a consolidation phase at a price top or bottom. The most important characteristic of a spinning top or bottom is the small body. The body can be black or white and has no shadows up to big shadows. As such, this candle is neutral, and the market does not know which way to go. Nevertheless, just like a doji, this might be the first indication of a possible price reversal. |
|

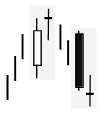
Tweezer Tops and Bottoms
|
Two or more candles with tops or bottoms at the same price level indicate resistance or support. The first candle is preferably the bigger candle; the second is the smaller one. The same price level does not have to be the high or low prices. A combination with a closing or an opening price is also acceptable. Tweezer tops and bottoms are reliable reversal patterns. |
|

Candlestick Charts Next -Previous -Part 1 -Part 2 -Part 3 -Part 4 -Part 5 -Part6 -Part7
STOCATA Stocks Technical Analysis HOME
Links
Find a Stock ticker symbol, enter the ticker and find a chart, news, fundamentals and historical quotes.
Risk Disclosure: Futures and forex trading contains substantial risk and is not for every investor. An investor could potentially lose all or more than the initial investment. Risk capital is money that can be lost without jeopardizing ones’ financial security or life style. Only risk capital should be used for trading and only those with sufficient risk capital should consider trading. Past performance is not necessarily indicative of future results.
Hypothetical Performance Disclosure: Hypothetical performance results have many inherent limitations, some of which are described below. no representation is being made that any account will or is likely to achieve profits or losses similar to those shown; in fact, there are frequently sharp differences between hypothetical performance results and the actual results subsequently achieved by any particular trading program. One of the limitations of hypothetical performance results is that they are generally prepared with the benefit of hindsight. In addition, hypothetical trading does not involve financial risk, and no hypothetical trading record can completely account for the impact of financial risk of actual trading. for example, the ability to withstand losses or to adhere to a particular trading program in spite of trading losses are material points which can also adversely affect actual trading results. There are numerous other factors related to the markets in general or to the implementation of any specific trading program which cannot be fully accounted for in the preparation of hypothetical performance results and all which can adversely affect trading results.
See more 'Legal Disclosures' in the bottom menu bar!