
Latest News
2022 Start working on a new website
BBS Trading Expert
Watch the Youtube BBS video and here is a crude oil trading example
Want to know more about:
AXIOM business books awards, bronze medal! Thank You!
No longer available!
Favorite articles in 2010, 11, 12, 14 and 2015 S&C Readers' Choice Awards.

AXIOM Business Books Awards, bronze medal.

Band Break System BBS
Trading results trading daily bars
BBS - Intro - Results - Template - Basic - More_money - Selecting_stocks
BBS will mainly profit from trading long positions, but will also trade short during a longer term downtrend.
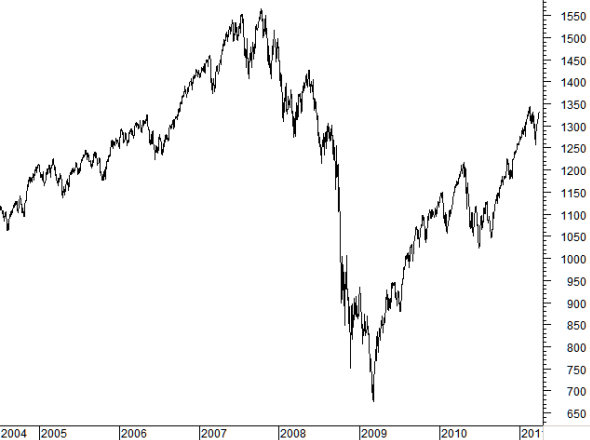
Let’s first have a look at the evolution of the S&P500 index during our test period; August 2004 till beginning of April 2011. A buy and hold strategy of the 500 stocks in the S&P500 would have made only a very small profit in the order of 20%.
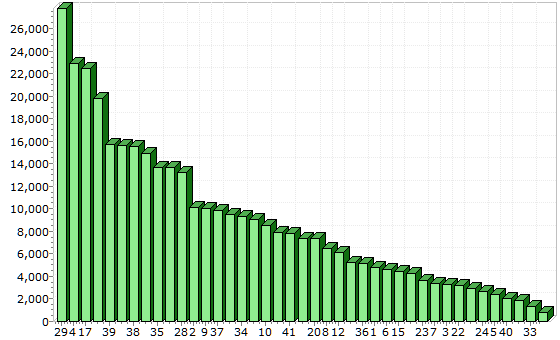
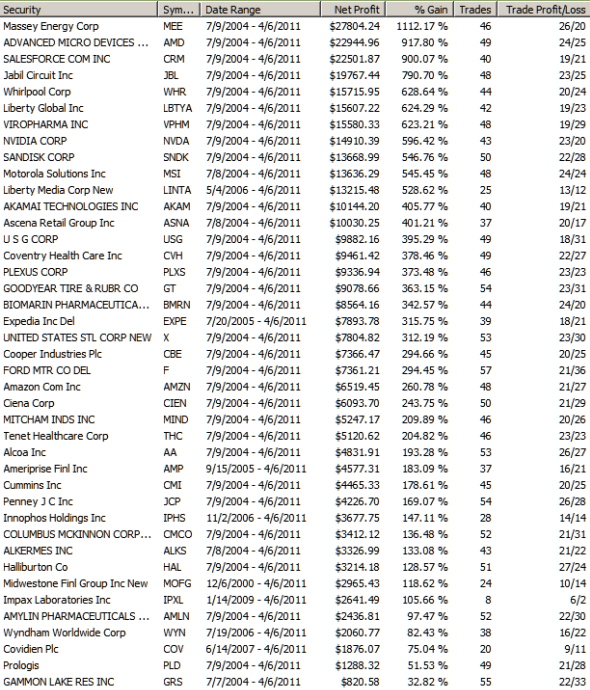
Using the same time period and using automatic trading based on BBS with 42 selected stocks (how we select the stocks I will show later on) gives a total profit of 352% with an average of 42 trades per stock backtesting with a simulated account.
These were the trading rules:
- $2500 starting capital per stock.
- No profit or loss sharing between the stocks (profit is compounded per individual stock).
- Trading long and short with the basic BBS system rules.
All 42 stocks made a profit.
Avoiding non-profitable trades
Believe me if I say that there is no perfect full automatic trading system. Avoiding some non-profitable trades can therefore make a big difference. This is also greatly due to the compounding trading strategy applied within the BBS system.
You can of course just use the BBS system and make your profit trading all signals. On the other hand, we all know there is really no perfect system and if you are prepared to invest some time in analyzing the trades proposed by BBS, I can give you additional techniques and indicators to avoid some of the losing trades without compromising the BBS system.
That will certainly boost your profit!
Later on I will show examples how to avoid losing trades triggered by BBS. Only a couple of indicators and basic technical analysis, like support and resistance, will be used in this process. You can always find all basic technical analysis techniques fully explained in my book “Capturing Profit with Technical Analysis”.
BBS and forex EUR.USD
As long as there are regular and large enough price moves, BBS can be used in different time frames and different kind of instruments.
BBS Trading the forex EUR.USD 15 minute bars
A successful application is the use of BBS for the EUR.USD currency pair in the forex market. Tests show that BBS is profitable in the 15 minutes and 60 minutes time frame. Please note that indicator settings may have to be set different depending of your broker.
Forex is not a centralized market and price charts will differ from broker to broker, and with a demo or a live account. I performed the tests with a AAAFx demo account using MetaTrader4.
In the next figure you can see the 15 minute EUR.USD currency pair bar chart.
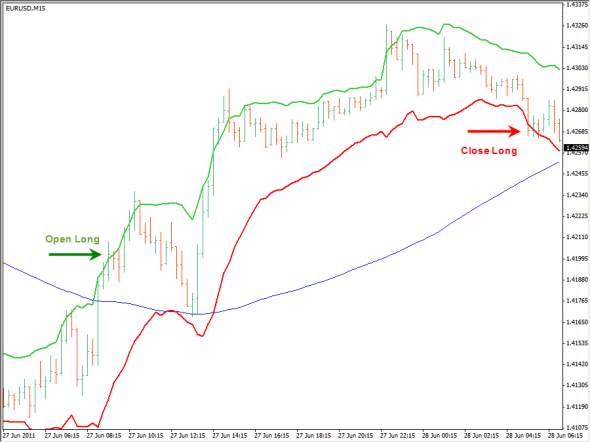
The thick green line is the upper BBS band and the thick red line is the lower BBS band. The average used is 13 periods. The look back reference period is 6 with a 1.8 bands deviation factor. The blue line is a 100 periods long term moving average on the closing price.
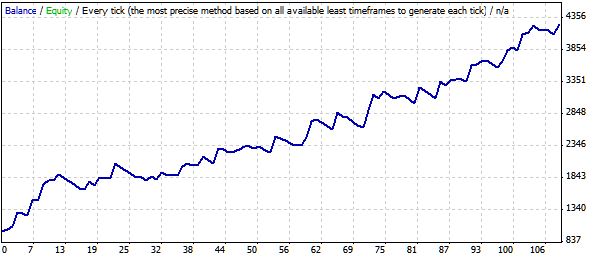
I am using the BBS Expert Advisor (EA) for the 15 minutes EUR.USD forex pair for the period 12/24/2010 till 07/22/2011.This is about 7 months of 15-minute bars. The modeling is done on tick level. There are about 14500 bars in test. We use an initial deposit of $1000 and trade at $1 per pip (1 lot in a mini account). The total profit is $3251 with 108 trades or 325% profit in about 7 months' time backtesting on a simulated demo account.
The maximum drawdown was limited to $365. The largest profitable trade was $259, while the largest loss trade was $59. The average profit trade was $118 with the average loss trade at $41. In the following figure you can see the equity evolution.
Since the maximum drawdown here is limited to $365, trading one mini lot size, we could risk trading 3 mini lots instead of one with the $1000 starting capital. The result is a profit of $9814 or almost 1000% profit in 7 months' time backtesting the simulated account.
If you really want to gamble (ouch! I should not use that word in a trading), with the hope you are starting to trade that right moment in time with a profit, you could even try it with a standard lot (10 mini lots) or $10 per pip. The result here? A total profit of $32716 backtesting with a simulated demo account. We were lucky, there was already enough money when we touched the drawdown of $3650, so there was no margin call. Do NOT try this, unless you really intend to g a m b l e
BBS Introduction - NEXT BBS Template
STOCATA Stocks Technical Analysis HOME
Links
Find a Stock ticker symbol, enter the ticker and find a chart, news, fundamentals and historical quotes.
Risk Disclosure: Futures and forex trading contains substantial risk and is not for every investor. An investor could potentially lose all or more than the initial investment. Risk capital is money that can be lost without jeopardizing ones’ financial security or life style. Only risk capital should be used for trading and only those with sufficient risk capital should consider trading. Past performance is not necessarily indicative of future results.
Hypothetical Performance Disclosure: Hypothetical performance results have many inherent limitations, some of which are described below. no representation is being made that any account will or is likely to achieve profits or losses similar to those shown; in fact, there are frequently sharp differences between hypothetical performance results and the actual results subsequently achieved by any particular trading program. One of the limitations of hypothetical performance results is that they are generally prepared with the benefit of hindsight. In addition, hypothetical trading does not involve financial risk, and no hypothetical trading record can completely account for the impact of financial risk of actual trading. for example, the ability to withstand losses or to adhere to a particular trading program in spite of trading losses are material points which can also adversely affect actual trading results. There are numerous other factors related to the markets in general or to the implementation of any specific trading program which cannot be fully accounted for in the preparation of hypothetical performance results and all which can adversely affect trading results.
See more 'Legal Disclosures' in the bottom menu bar!