
Latest News
2022 Start working on a new website
BBS Trading Expert
Watch the Youtube BBS video and here is a crude oil trading example
Want to know more about:
AXIOM business books awards, bronze medal! Thank You!
No longer available!
Favorite articles in 2010, 11, 12, 14 and 2015 S&C Readers' Choice Awards.

AXIOM Business Books Awards, bronze medal.

S&P500 Analysis: -Daily -Weekly -Monthly -Template -Formulas -Real-Time - HOME
S&P500 Technical Analysis
Please look at all charts, monthly, weekly and daily before making your own conclusion. You can find HERE a description of the chart template used.
Monthly chart
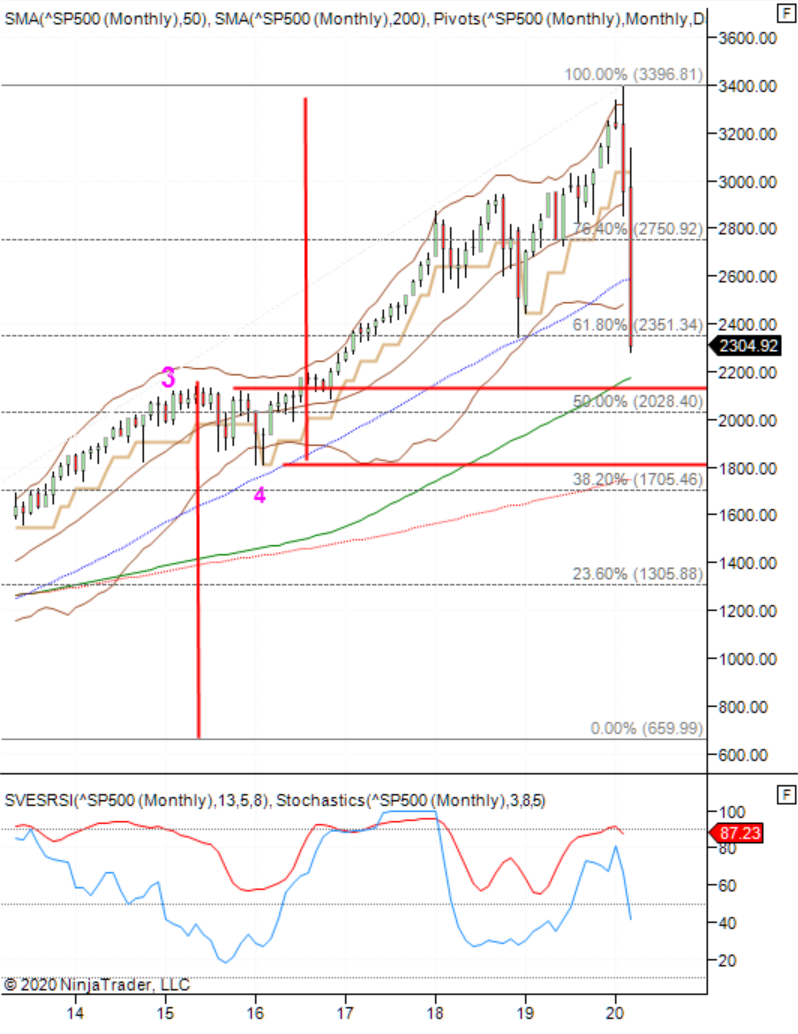
03/28/2020
Here is the updated chart. No change in comments. The index moved further down.
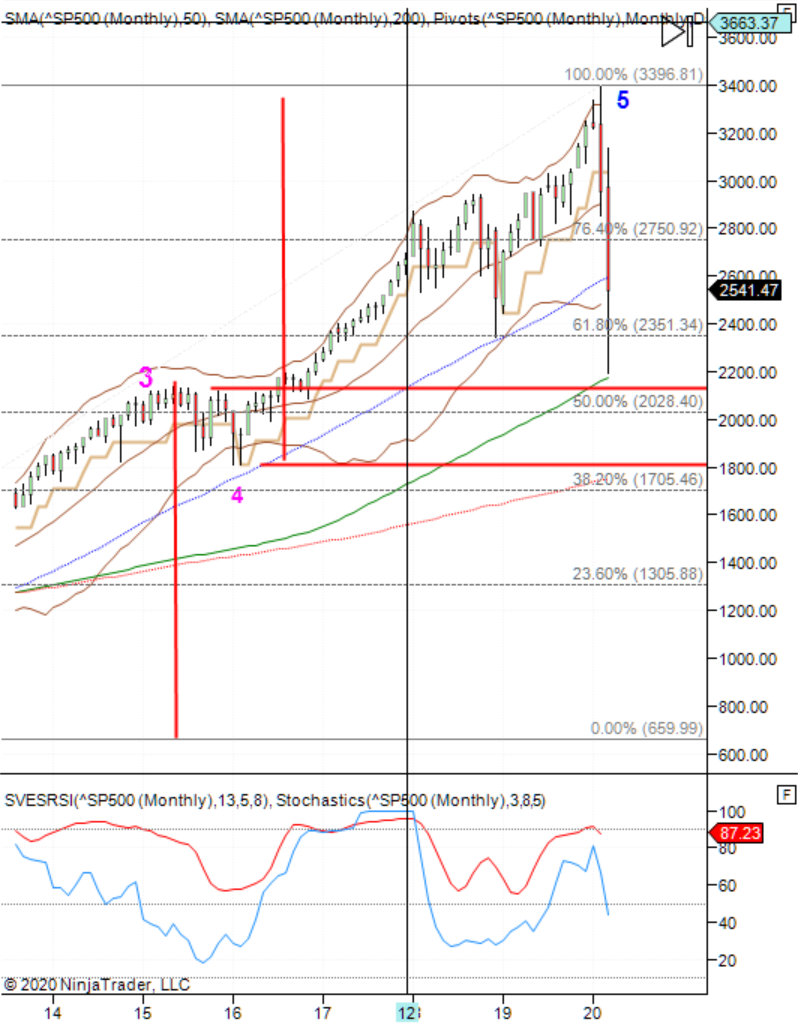
03/14/2020:
This text will generally only be adapted once every month. The chart is updated until 03/14/2020. The chart template is explained HERE.
Since I am very occupied daytrading with applying my V-Trade system, I will not update my comments on a regular basis. However, I will try to make new comments when I note some important changes.
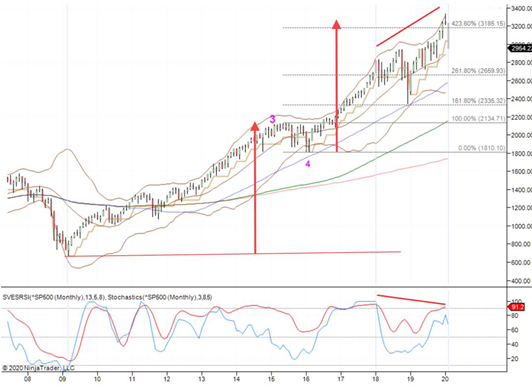
The last monthly S&P500 top was announced by a 423.6% Fibonacci projection over an Elliott wave 4 in 2015. January 2020 shows a Bearish Shooting Star as a first reversal warning. February 2020 follows with a large negative candle forming a candlestick evening star reversal pattern. Two more facts confirm this reversal sign: The negative divergence with, lower tops in the Stochastic RSI indicator, compared to higher tops in price level. The size of the move up to the wave 3 projected up from the bottom of wave 4 gave a price target close to the 423.6% Fibonacci target.
Drawing a Fibonacci retracement over the large up move since March 2009, there is a retrace down, past the 50-month moving average (blue). Now touching the low side of the Bollinger band and, coming near to the 61.8% Fibonacci retrace. We can expect a further move down to the 50% retrace level. In that neighborhood there are two more target levels: A price support from the top of wave 3 and, support from the 100-month simple moving average (green). One more target is given by the bottom of the previous wave 4. Around that level there is support from the 200-day Simple Moving Average and, from the 38.2% Fibonacci retracement. This is a further move down to an S&P500 target between 2100 and 1800.

S&P500 Analysis Charts: -Daily -Weekly -Monthly -Template -Formulas -SPY Real Time
STOCATA Stocks Technical Analysis HOME
Links
Find a Stock ticker symbol, enter the ticker and find a chart, news, fundamentals and historical quotes.
Risk Disclosure: Futures and forex trading contains substantial risk and is not for every investor. An investor could potentially lose all or more than the initial investment. Risk capital is money that can be lost without jeopardizing ones’ financial security or life style. Only risk capital should be used for trading and only those with sufficient risk capital should consider trading. Past performance is not necessarily indicative of future results.
Hypothetical Performance Disclosure: Hypothetical performance results have many inherent limitations, some of which are described below. no representation is being made that any account will or is likely to achieve profits or losses similar to those shown; in fact, there are frequently sharp differences between hypothetical performance results and the actual results subsequently achieved by any particular trading program. One of the limitations of hypothetical performance results is that they are generally prepared with the benefit of hindsight. In addition, hypothetical trading does not involve financial risk, and no hypothetical trading record can completely account for the impact of financial risk of actual trading. for example, the ability to withstand losses or to adhere to a particular trading program in spite of trading losses are material points which can also adversely affect actual trading results. There are numerous other factors related to the markets in general or to the implementation of any specific trading program which cannot be fully accounted for in the preparation of hypothetical performance results and all which can adversely affect trading results.
See more 'Legal Disclosures' in the bottom menu bar!