
Latest News
2022 Start working on a new website
BBS Trading Expert
Watch the Youtube BBS video and here is a crude oil trading example
Want to know more about:
AXIOM business books awards, bronze medal! Thank You!
No longer available!
Favorite articles in 2010, 11, 12, 14 and 2015 S&C Readers' Choice Awards.

AXIOM Business Books Awards, bronze medal.

Technical Analysis Price Patterns
Chart patterns are part of buying and selling rules. Most of the time there will already be an open position at the appearance of a price chart pattern. The point is that it gives an important confirmation for the already taken decision. Furthermore, some patterns will help to calculate future price targets.
Medium- and long-term trend reversals are often gradual. The art is to distinguish that you are dealing with a continuation pattern, after which the price will continue its previous trend or a reversal pattern leading to a trend reversal.
Special offer: "Capturing Profit with technical Analysis"
Reversal Patterns
Head and Shoulders Formation
The head and shoulders formation belongs with an accuracy of about 90% to the most reliable reversal patterns
Head and Shoulders Top Reversal Pattern
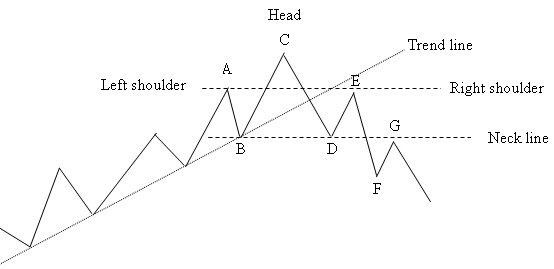
Figure 4.39: Head and shoulders top reversal principle.
The price moves in an uptrend. Only after the pattern has formed, you will recognize A as the left shoulder (figure 4.39). The price drops back to the support B of the up-going trendline. From here, the price makes a last move up to C often with lower volume compared to the A move. This will be the head of the pattern. The turning point at B will be part of the neck line.
Next the price drops through the up-going trendline and falls back to the level of the neck line D. After that, the price will move up again to E to form the right shoulder. From here the price will drop below the neck line making lower lows.
The shoulders (A-E) and the neck line (B-D) in the head and shoulders formation should be at about the same price level and at about the same distance in time from the head.
The head and shoulders pattern is confirmed when the price falls below an up-trending neck line or after the right shoulder in case of a down-trending neck line.
ATTENTION! In approximately half of the cases, there is a bounce back up to the neck line G, or even up to between the neck line and the right shoulder.
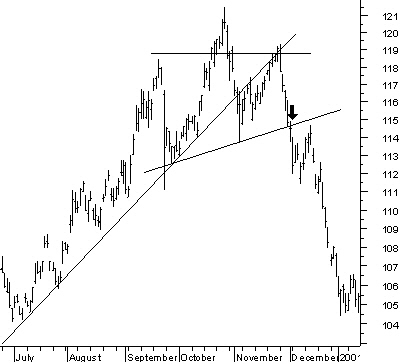
Figure 4.40: Head and shoulders top reversal pattern.
Figure 4.40 shows an example of a head and shoulders top reversal pattern in the Euro-dollar currency pair.
Head and Shoulders Bottom Reversal Pattern
Mirroring the head and shoulders top reversal pattern gives a head and shoulders bottom reversal pattern. Shoulder bottoms should be at around the same price level and at about the same distance from the head.
The head and shoulders bottom reversal pattern is confirmed when the price moves above a descending neck line or after the right shoulder with an ascending neck line.
ATTENTION! In approximately half of the cases, there is a bounce back down to the neck line or even down to between the neck line and the right shoulder.
Look at figure 4.41 for an example of a head and shoulders bottom reversal.
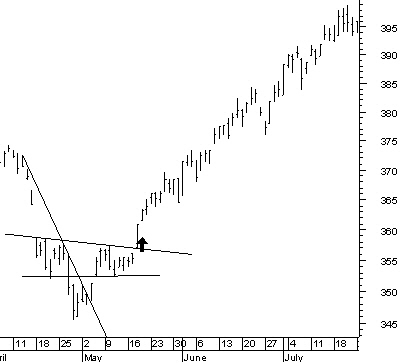
Figure 4.41: Head and shoulders bottom reversal pattern.
Technical Analysis Price Patterns NEXT -Part 1 -Part 2 -Part 3 -Part 4 -Part 5 -part 6
STOCATA Stocks Technical Analysis HOME
Links
Find a Stock ticker symbol, enter the ticker and find a chart, news, fundamentals and historical quotes.
Risk Disclosure: Futures and forex trading contains substantial risk and is not for every investor. An investor could potentially lose all or more than the initial investment. Risk capital is money that can be lost without jeopardizing ones’ financial security or life style. Only risk capital should be used for trading and only those with sufficient risk capital should consider trading. Past performance is not necessarily indicative of future results.
Hypothetical Performance Disclosure: Hypothetical performance results have many inherent limitations, some of which are described below. no representation is being made that any account will or is likely to achieve profits or losses similar to those shown; in fact, there are frequently sharp differences between hypothetical performance results and the actual results subsequently achieved by any particular trading program. One of the limitations of hypothetical performance results is that they are generally prepared with the benefit of hindsight. In addition, hypothetical trading does not involve financial risk, and no hypothetical trading record can completely account for the impact of financial risk of actual trading. for example, the ability to withstand losses or to adhere to a particular trading program in spite of trading losses are material points which can also adversely affect actual trading results. There are numerous other factors related to the markets in general or to the implementation of any specific trading program which cannot be fully accounted for in the preparation of hypothetical performance results and all which can adversely affect trading results.
See more 'Legal Disclosures' in the bottom menu bar!