
Latest News
2022 Start working on a new website
BBS Trading Expert
Watch the Youtube BBS video and here is a crude oil trading example
Want to know more about:
AXIOM business books awards, bronze medal! Thank You!
No longer available!
Favorite articles in 2010, 11, 12, 14 and 2015 S&C Readers' Choice Awards.

AXIOM Business Books Awards, bronze medal.

Technical Analysis Price Patterns Part 4
Reversing/Continuation Patterns
Some of the patterns we consider can appear as a reversal or as a continuation pattern.
Rounding Top as a Reversing Pattern
A rounding top pattern (inverse rounded bowl shape) appears on daily and weekly bar charts.
Special offer: "Capturing Profit with technical Analysis"
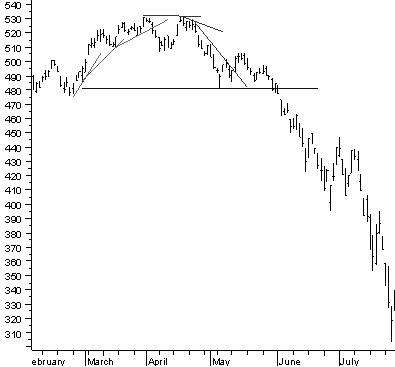
Figure 4.60: Rounding top reversal pattern.
A rounding top starts with a steep rising trendline (figure 4.60) which with time becomes increasingly flat. Rounding tops as a reversing pattern break to the down side and lead to a farther move down 90% of the time. The pattern confirms when the price closes below the left-hand border or with a saucer lip when breaking the right-hand side of the border.
Rounding Top as a Continuation Pattern
A break to the upper side of the saucer gives, on average, less profit than a break to the lower side. This is simply because, as a continuation pattern, part of the up-move already has been completed.
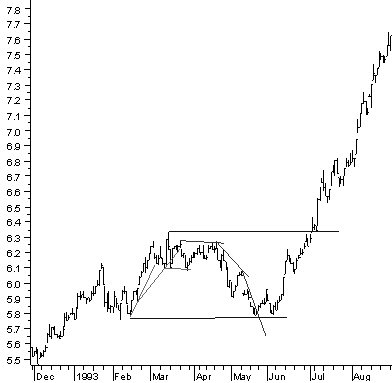
Figure 4.61: Rounding top continuation pattern.
A rounding top as a continuation pattern is confirmed when the price moves above the highest point of the rounding top (figure 4.61).
Diamond Formation
The diamond formation is a combination of two triangles. The left is an inverted broadening triangle; the right side is a symmetrical triangle. Together they make up a diamond formation.
This pattern is most common as a continuation pattern, but it can be a top or bottom reversal pattern as well.
Diamond Formation as a Continuation Pattern
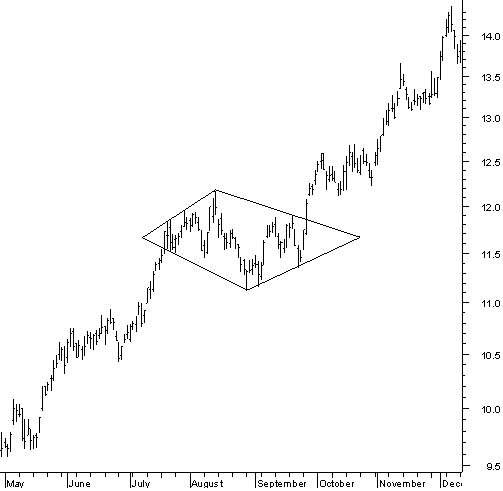
Figure 4.62 shows a diamond continuation pattern.
Diamond Formation as a Reversal Pattern
Top Reversal
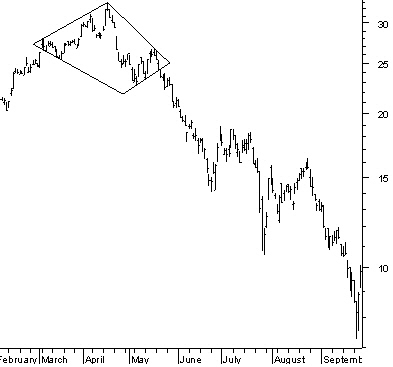
Figure 4.63 shows a diamond top reversal pattern.
Search the Internet
Price Patterns NEXT -Previous -Part 1 -Part 2 -Part 3 -Part 4 -Part 5 -Part 6
STOCATA Stocks Technical Analysis HOME
Links
Find a Stock ticker symbol, enter the ticker and find a chart, news, fundamentals and historical quotes.
Risk Disclosure: Futures and forex trading contains substantial risk and is not for every investor. An investor could potentially lose all or more than the initial investment. Risk capital is money that can be lost without jeopardizing ones’ financial security or life style. Only risk capital should be used for trading and only those with sufficient risk capital should consider trading. Past performance is not necessarily indicative of future results.
Hypothetical Performance Disclosure: Hypothetical performance results have many inherent limitations, some of which are described below. no representation is being made that any account will or is likely to achieve profits or losses similar to those shown; in fact, there are frequently sharp differences between hypothetical performance results and the actual results subsequently achieved by any particular trading program. One of the limitations of hypothetical performance results is that they are generally prepared with the benefit of hindsight. In addition, hypothetical trading does not involve financial risk, and no hypothetical trading record can completely account for the impact of financial risk of actual trading. for example, the ability to withstand losses or to adhere to a particular trading program in spite of trading losses are material points which can also adversely affect actual trading results. There are numerous other factors related to the markets in general or to the implementation of any specific trading program which cannot be fully accounted for in the preparation of hypothetical performance results and all which can adversely affect trading results.
See more 'Legal Disclosures' in the bottom menu bar!