
Latest News
2022 Start working on a new website
BBS Trading Expert
Watch the Youtube BBS video and here is a crude oil trading example
Want to know more about:
AXIOM business books awards, bronze medal! Thank You!
No longer available!
Favorite articles in 2010, 11, 12, 14 and 2015 S&C Readers' Choice Awards.

AXIOM Business Books Awards, bronze medal.

Technical Analysis Price Patterns Part 2
Reversal Patterns
Double Tops and Bottoms
Double Top
A double top reversal pattern is formed with a large demand during the formation of the first top and a lack of demand with the second top.
Special offer: "Capturing Profit with technical Analysis"
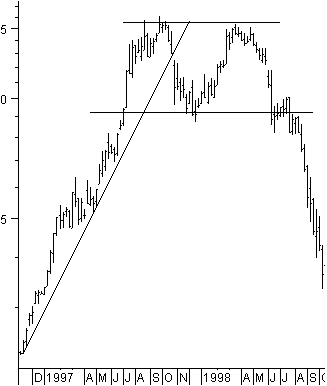
With daily price bars (figure 4.46), tops are separated by about four to eight weeks and should only have a small difference in price level. The in between reaction should have a price drop of about 10% measured from the first top.
With an accuracy of 80%, this pattern is very reliable.
The pattern is confirmed when the price falls below the level of the middle reaction.
Figure 4.46: Double top pattern.
Double Bottom
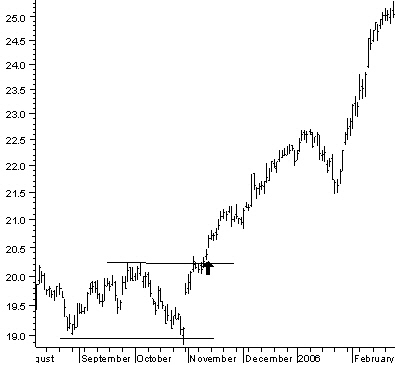 For a double bottom, the reasoning is analogous to that of a double top. The trend is down, and a double bottom pattern is formed as an indication that the trend probably will reverse.
With daily price bars, bottoms are separated by about four to eight weeks (figure 4.47) and should only have a small difference in price level. The in between reaction should have a price rise of about 10% measured from the first bottom.
With 80% reversals, this pattern is very reliable.
The pattern is confirmed when the price rises above the level of the middle reaction.
Figure 4.47: Double bottom pattern
Rounding Bottoms
A rounding bottom pattern (rounded bowl shape) appears on daily and weekly bar charts.
This pattern takes time to complete.
The price can peak halfway through the pattern, but usually it retraces most of it quickly.
Rounding bottoms are becoming rare because of the high volatility of the markets as a result of the information society.
Rounding bottoms lead to a price reversal 90% of the time.
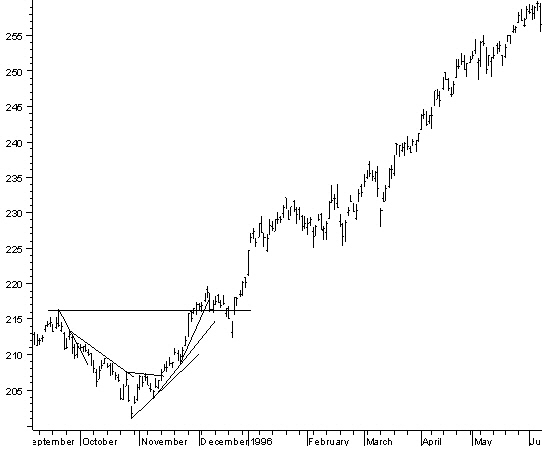
Figure 4.48: Rounding bottom pattern.
Like in figure 4.48, a rounding bottom starts with a steep falling trendline that with time, becomes increasingly flat.
The opposite is true in most of the other patterns; that is, you start with a flat trendline and finish with a steeper trendline.
The pattern confirms when the price closes above the highest peak of the pattern. There may be a saucer lip when the price drops temporarily before continuing the uptrend.
>V-formations
In a V-formation, you are looking for a V-shaped reversal pattern from a range of bars. A bottom reversal creates a V-character; a top reversal creates an inverted V-character.
The price at the start of the V-formation will form either a one-day reversal, an island reversal, or a spark.
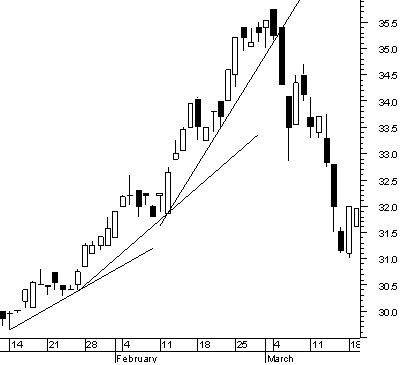
Figure 4.49: V-formation; one day top reversal.
A one day top reversal (figure 4.49) arises if the price makes a new high on the same day and reverses and closes below the closing price of the previous day. A one-day top reversal in a candle chart is a black candle and often is part of a candlestick pattern.
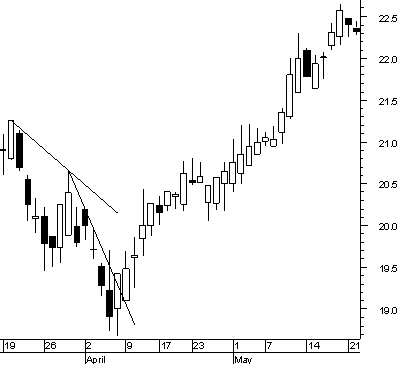
Figure 4.50: V-formation; one day bottom reversal.
A one-day bottom reversal (figure 4.50) arises if the price makes a new low on the same day and reverses and closes above the closing price of the previous day.
An island reversal occurs when there is a window between the prices of today, the previous day, and the following day(s).
A spark is a big, one-day high volatility price move. A V-formation start can be recognized most of the time when it breaks the last possible steep trendline, together with a candle stick reversal pattern just before, and a one-day island or spark reversal.
Price Patterns NEXT -Previous -Part 1 -Part 2 -Part 3 -Part 4 -Part 5 -Part 6
STOCATA Stocks Technical Analysis HOME
Links
Find a Stock ticker symbol, enter the ticker and find a chart, news, fundamentals and historical quotes.
Risk Disclosure: Futures and forex trading contains substantial risk and is not for every investor. An investor could potentially lose all or more than the initial investment. Risk capital is money that can be lost without jeopardizing ones’ financial security or life style. Only risk capital should be used for trading and only those with sufficient risk capital should consider trading. Past performance is not necessarily indicative of future results.
Hypothetical Performance Disclosure: Hypothetical performance results have many inherent limitations, some of which are described below. no representation is being made that any account will or is likely to achieve profits or losses similar to those shown; in fact, there are frequently sharp differences between hypothetical performance results and the actual results subsequently achieved by any particular trading program. One of the limitations of hypothetical performance results is that they are generally prepared with the benefit of hindsight. In addition, hypothetical trading does not involve financial risk, and no hypothetical trading record can completely account for the impact of financial risk of actual trading. for example, the ability to withstand losses or to adhere to a particular trading program in spite of trading losses are material points which can also adversely affect actual trading results. There are numerous other factors related to the markets in general or to the implementation of any specific trading program which cannot be fully accounted for in the preparation of hypothetical performance results and all which can adversely affect trading results.
See more 'Legal Disclosures' in the bottom menu bar!