
Latest News
2022 Start working on a new website
BBS Trading Expert
Watch the Youtube BBS video and here is a crude oil trading example
Want to know more about:
AXIOM business books awards, bronze medal! Thank You!
No longer available!
Favorite articles in 2010, 11, 12, 14 and 2015 S&C Readers' Choice Awards.

AXIOM Business Books Awards, bronze medal.

Technical Analysis Price Patterns Part 5
Wedge Formations
 Wedge formations in are not only interesting as reversal or continuation patterns but are also good for recognizing an Elliott beginning or ending wedge impulse wave. So they will help to make a correct Elliott wave count in generally difficult circumstances.
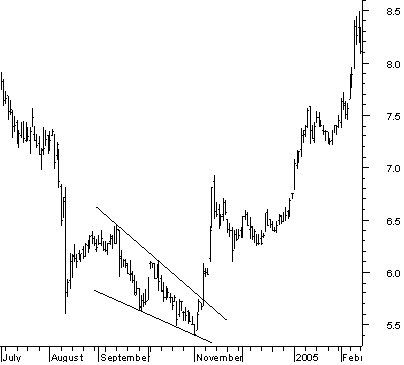
Falling Wedge Reversal Pattern
The falling wedge exists as a reversing pattern in a falling trend and as a continuation pattern in a rising trend. The duration of the wedge should be a minimum of 20 bars; with fewer than 20 bars, it is considered a flag.
Figure 4.65: Falling wedge reversal pattern.
Special offer: "Capturing Profit with technical Analysis"
Breaking out of a falling wedge is generally a bullish signal (figure 4.65). Rarely will you see the price breaking a falling wedge to the lower side.
Falling Wedge Continuation Pattern
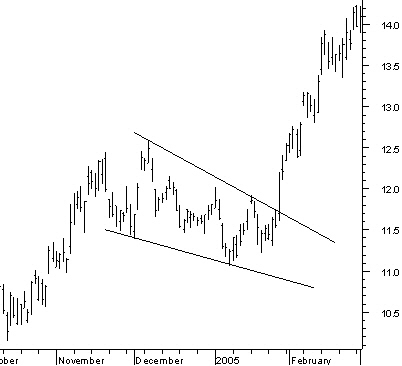
A falling wedge continuation pattern in a rising trend is a price reaction in the up-going move.
The chance for a big profit is less than for a falling wedge reversal pattern because part of the up-move is already history (figure 4.66).
Figure 4.66: Falling wedge continuation pattern.
Pay attention to the rare falling wedge after the top of an up-trend.
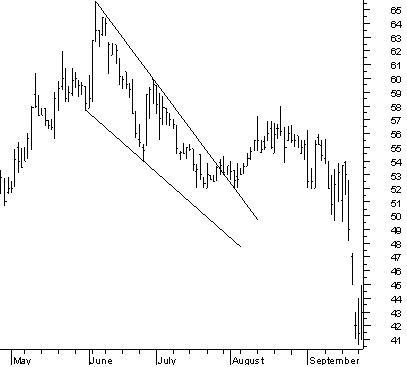 In figure 4.67, the falling wedge from the top probably is the first reaction after a longer-term uptrend.
As a result the breakout to the upper side is more likely a temporary reaction against the new longer-term down-move.
Figure 4.67: Falling wedge after a top formation.
Price Patterns NEXT -Previous -Part 1 -Part 2 -Part 3 -Part 4 -Part 5 -Part 6
STOCATA Stocks Technical Analysis HOME
Links
Find a Stock ticker symbol, enter the ticker and find a chart, news, fundamentals and historical quotes.
Risk Disclosure: Futures and forex trading contains substantial risk and is not for every investor. An investor could potentially lose all or more than the initial investment. Risk capital is money that can be lost without jeopardizing ones’ financial security or life style. Only risk capital should be used for trading and only those with sufficient risk capital should consider trading. Past performance is not necessarily indicative of future results.
Hypothetical Performance Disclosure: Hypothetical performance results have many inherent limitations, some of which are described below. no representation is being made that any account will or is likely to achieve profits or losses similar to those shown; in fact, there are frequently sharp differences between hypothetical performance results and the actual results subsequently achieved by any particular trading program. One of the limitations of hypothetical performance results is that they are generally prepared with the benefit of hindsight. In addition, hypothetical trading does not involve financial risk, and no hypothetical trading record can completely account for the impact of financial risk of actual trading. for example, the ability to withstand losses or to adhere to a particular trading program in spite of trading losses are material points which can also adversely affect actual trading results. There are numerous other factors related to the markets in general or to the implementation of any specific trading program which cannot be fully accounted for in the preparation of hypothetical performance results and all which can adversely affect trading results.
See more 'Legal Disclosures' in the bottom menu bar!