
Latest News
2022 Start working on a new website
BBS Trading Expert
Watch the Youtube BBS video and here is a crude oil trading example
Want to know more about:
AXIOM business books awards, bronze medal! Thank You!
No longer available!
Favorite articles in 2010, 11, 12, 14 and 2015 S&C Readers' Choice Awards.

AXIOM Business Books Awards, bronze medal.

S&P500 Analysis: -Daily -Weekly -Monthly -Template -Formulas -Real-Time - HOME
S&P500 Technical Analysis
Chart Template
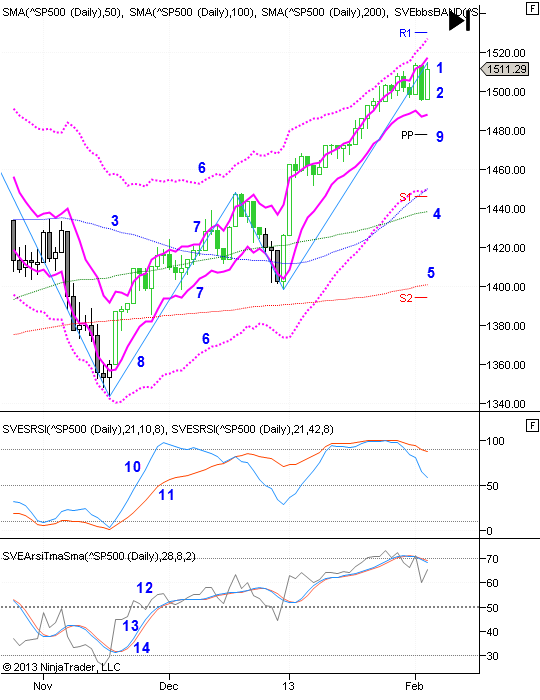
Below the latest chart template (May 2013) I use it to follow the US market S&P500 index, stocks and futures and forex EurUsd. The charting program used is NinjaTrader®.
I will use a monthly, weekly and daily chart, for a long, medium and a short term view of the market. The basic price chart will be a candle chart [1]. Prices are color coded by my "SVEPRExp" expert system [2] (proprietary indicator). Green for a long position and black for a short position. In the same main window I use three simple moving averages [3]=50, [4]=100 and [5]=200, mainly used looking for dynamic support and resistance levels. Purple dotted [6] is a deviation band system "SVEbbsBand" (available with the Band Indicators DVD), where price moves within the lower and upper band. The full purple lines [7] is the same band but with a setting to show buy and sell signals. [8] is a high-low zigzag to be used as an aid to count 123 waves. [9] Are calculated pivot points (Monthly for a daily chart) on the price of the previous Month. [10] is a stochastic RSI looking at shorter term moves and [11] looks at longer term moves. [12] Is my ARSI (Asymmetrical RSI) indicator used for short term overbought and oversold indications mainly looking for divergences between price and the indicator. [13] is a TEMA average on ARSI and [14] is a short SMA on the TEMA average creating crossovers.
Of course I will use Fibonacci projections and retracement and I will use pitchfork channels. I will look at candlestick and price patterns and count waves.
Special offer: "Capturing Profit with technical Analysis".
NEW! My BBS expert system now available with "Band Indicators" DVD.
Eventual price projections will be made with the help of Fibonacci projections and the Andrews pitchfork.

S&P500 Analysis Charts: -Daily -Weekly -Monthly -Template -Formulas -SPY Real Time
STOCATA Stocks Technical Analysis HOME
Links
Find a Stock ticker symbol, enter the ticker and find a chart, news, fundamentals and historical quotes.
Risk Disclosure: Futures and forex trading contains substantial risk and is not for every investor. An investor could potentially lose all or more than the initial investment. Risk capital is money that can be lost without jeopardizing ones’ financial security or life style. Only risk capital should be used for trading and only those with sufficient risk capital should consider trading. Past performance is not necessarily indicative of future results.
Hypothetical Performance Disclosure: Hypothetical performance results have many inherent limitations, some of which are described below. no representation is being made that any account will or is likely to achieve profits or losses similar to those shown; in fact, there are frequently sharp differences between hypothetical performance results and the actual results subsequently achieved by any particular trading program. One of the limitations of hypothetical performance results is that they are generally prepared with the benefit of hindsight. In addition, hypothetical trading does not involve financial risk, and no hypothetical trading record can completely account for the impact of financial risk of actual trading. for example, the ability to withstand losses or to adhere to a particular trading program in spite of trading losses are material points which can also adversely affect actual trading results. There are numerous other factors related to the markets in general or to the implementation of any specific trading program which cannot be fully accounted for in the preparation of hypothetical performance results and all which can adversely affect trading results.
See more 'Legal Disclosures' in the bottom menu bar!