
Latest News
2022 Start working on a new website
BBS Trading Expert
Watch the Youtube BBS video and here is a crude oil trading example
Want to know more about:
AXIOM business books awards, bronze medal! Thank You!
No longer available!
Favorite articles in 2010, 11, 12, 14 and 2015 S&C Readers' Choice Awards.

AXIOM Business Books Awards, bronze medal.

Technical Analysis Candlestick charts
Candlestick charts are my preferred chart type because I can use candle chart patterns as part of the buying and selling process to find short term price turning points and additionally these patterns are used for support and resistance.
Special offer: "Capturing Profit with technical Analysis"
If you are new to candlestick charts it will not be that easy learning and recognizing all the patterns. I would like to suggest that you read through the chapter and that you start by recognizing at least the following patterns.
Bottom reversal: Hammer, Engulfing bullish, Bullish harami (cross), Piercing line and Morning star patterns.
Top reversal: Hanging man, Engulfing bearish, Bearish harami (cross), Dark cloud cover and Evening star patterns.
Introduction
In the 1700s, a legendary Japanese rice trader named Homma used trading techniques that eventually evolved into the candlestick techniques that technical analysts on the Japanese stock market used in the 1870s. Steve Nison introduced these techniques to the Western world in his first book, Japanese Candlestick Charting Techniques.
The advantage of using candles on charts is that single or multiple candle patterns give earlier and more reliable reversal signals. Every candle shows the activity for the referenced period in hourly, daily, or weekly charts, for example.
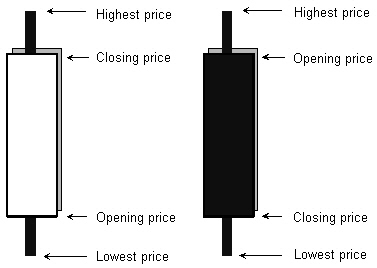
Figure 6.1: Horizontal reference points of the candlestick.
In figure 6.1, the horizontal reference points of the candle represent the opening price, the highest price, the lowest price, and the closing price of the considered period. The rectangular portion of the candle, or the body, represents the range between the opening and the closing prices. If the closing price is higher than the opening price, the body is white (not filled). If the closing price is lower than the opening price, the body is black (filled).
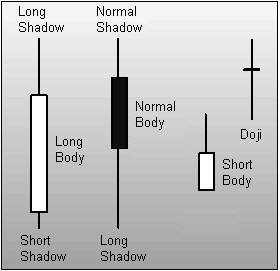 A candle consists of either just a body or a body with an upper and/or a lower shadow. A candle with an opening and closing price at almost the same price level is called a doji (figure 6.2). The candlewicks are called shadows, and they extend up to the highest price and down to the lowest price of the related period. Candlestick charts can be used in any time frame, including minutes, hours, days, weeks, or months.
Candlestick chart patterns are formed by one or more candles; they indicate a short-term trend reversal or a trend continuation. You must always take into account the previous trend when interpreting candlestick patterns.
Candlestick patterns do NOT give price targets!
Figure 6.2: Candlestick naming.
Format, Naming, and Meaning
Candlesticks Format Overview
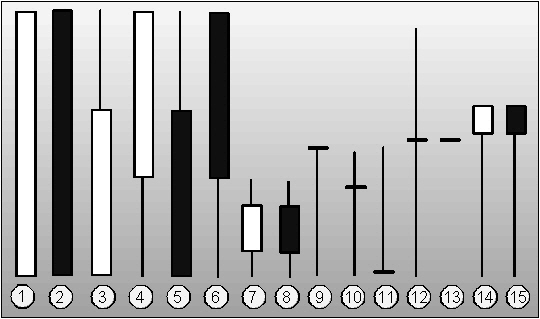
Figure 6.3: Candlesticks format description.
Format description:
Nr. |
Name |
Interpretation |
1 |
Big white body (White Marubozu) |
Very positive |
2 |
Big black body (Black Marubozu) |
Very negative |
3 |
White opening Marubozu |
Quite positive |
4 |
White closing Marubozu |
Positive |
5 |
Black closing Marubozu |
Negative |
6 |
Black opening Marubozu |
Quite negative |
7 |
White candle |
No direction |
8 |
Black candle |
No direction |
9 |
Dragonfly doji |
Reversal? |
10 |
Doji star |
Reversal? |
11 |
Gravestone doji |
Stable/Reversal |
12 |
Long-legged doji |
Reversal? |
13 |
Four price doji |
Reversal? |
14 |
Hammer (white) |
Bottom reversal |
15 |
Hammer (black) |
Bottom reversal |
Psychological Background
The candlesticks in figures 6.4 and 6.5 demonstrate the psychological trading that takes place during the period represented by a single candle.
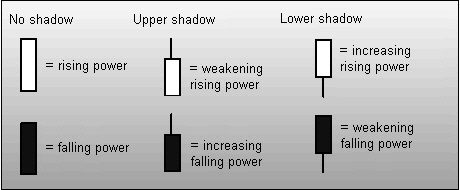
Figure 6.4: Candlesticks psychological background 1.
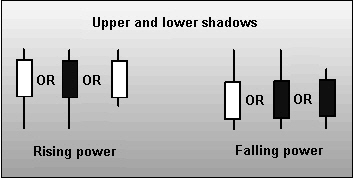
Figure 6.5: Candlesticks psychological background 2.
Figure 6.6 shows some rising power candles.
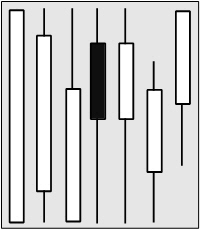
Figure 6.6: Rising power candles.
Figure 6.7 shows some candles with falling power.
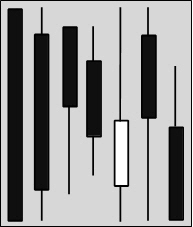
Figure 6.7: Falling power candles.
Figure 6.8 shows candles with reversal power.
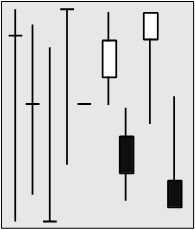
Figure 6.8: Candles with reversal power.
- A big white body means buyers are in power, and the trend is up.
- A big black body means sellers are in power, and the trend is down.
- A small body means that buyers and sellers are trying to take power.
- A big shadow below is a positive sign and indicates strength.
- A big shadow above is a negative sign and indicates weakness.
- A doji is a candle with opening and closing prices that are close together.
- A doji means that price acceleration is slowing down and that bulls and bears are in balance.
- A doji at a top or bottom often is the first signal of a price reversal.
Candlestick Charts Next -Part 1 -Part 2 -Part 3 -Part 4 -Part 5 -Part6 -Part7
STOCATA Stocks Technical Analysis HOME
Links
Find a Stock ticker symbol, enter the ticker and find a chart, news, fundamentals and historical quotes.
Risk Disclosure: Futures and forex trading contains substantial risk and is not for every investor. An investor could potentially lose all or more than the initial investment. Risk capital is money that can be lost without jeopardizing ones’ financial security or life style. Only risk capital should be used for trading and only those with sufficient risk capital should consider trading. Past performance is not necessarily indicative of future results.
Hypothetical Performance Disclosure: Hypothetical performance results have many inherent limitations, some of which are described below. no representation is being made that any account will or is likely to achieve profits or losses similar to those shown; in fact, there are frequently sharp differences between hypothetical performance results and the actual results subsequently achieved by any particular trading program. One of the limitations of hypothetical performance results is that they are generally prepared with the benefit of hindsight. In addition, hypothetical trading does not involve financial risk, and no hypothetical trading record can completely account for the impact of financial risk of actual trading. for example, the ability to withstand losses or to adhere to a particular trading program in spite of trading losses are material points which can also adversely affect actual trading results. There are numerous other factors related to the markets in general or to the implementation of any specific trading program which cannot be fully accounted for in the preparation of hypothetical performance results and all which can adversely affect trading results.
See more 'Legal Disclosures' in the bottom menu bar!