
Latest News
2022 Start working on a new website
BBS Trading Expert
Watch the Youtube BBS video and here is a crude oil trading example
Want to know more about:
AXIOM business books awards, bronze medal! Thank You!
No longer available!
Favorite articles in 2010, 11, 12, 14 and 2015 S&C Readers' Choice Awards.

AXIOM Business Books Awards, bronze medal.

Technical Analysis Candlestick charts Part 6
Continuation Patterns
Bullish Continuation Patterns
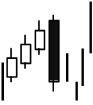
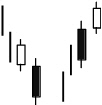
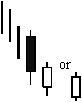
Bullish Three-line Strike
Special offer: "Capturing Profit with technical Analysis"
|
In an uptrend, there are three or more days of higher prices, followed by a big black candle covering most of the previous bars’ up-move. Wait for a confirmation. |
|
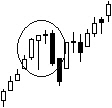
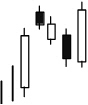
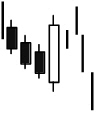
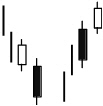
Rising Three
|
In an uptrend, a big white candle is followed by a number of small, mostly black bodies. The pattern ends with a big white candle with a new high price. |
|
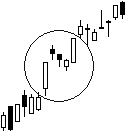
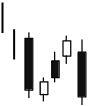
Mat Hold
|
This is a variation of the rising three. In an uptrend, a big white candle is followed by a small candle with a rising window and a lower closing price, forming an evening star pattern. Next, there are a number of small, mostly black candles. The pattern ends with a big white candle with a new high price. |
|
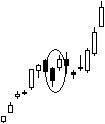
Separating Lines
|
In an uptrend, a black body is followed by a white body with the same opening price. |
|
Bearish Continuation Patterns
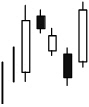
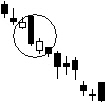
Bearish Three-line Strike
|
In a downtrend, there are three or more days of lower prices, followed by a big white candle covering most of the previous bars’ down-move. Wait for a confirmation. |
|
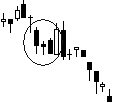
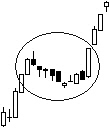
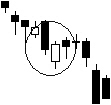
Falling Three
|
In a downtrend, a big black candle is followed by a number of small, mostly white bodies. The pattern ends with a big black candle with a new low price. |
|
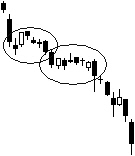
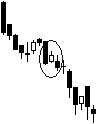
In-neck Line, On-neck Line
|
In a downtrend, a relatively big black body is followed by a white body with a lower opening price than the black candle’s closing price. With the in-neck line, the white body closes just within the black body. With the on-neck line, the white body closes within the lower shadow of the black body. |
|
Thrusting Line
|
In a downtrend, a relatively big black body is followed by a white body with a lower opening price than the black candle’s closing price. The white body closes below the midpoint of the black body, not forming a piercing line. |
|

Separating Lines
|
In a downtrend, a white body is followed by a black body with the same opening price. |
|
Candlestick Charts Next -Previous -Part 1 -Part 2 -Part 3 -Part 4 -Part 5 -Part6 -Part7
STOCATA Stocks Technical Analysis HOME
Links
Find a Stock ticker symbol, enter the ticker and find a chart, news, fundamentals and historical quotes.
Risk Disclosure: Futures and forex trading contains substantial risk and is not for every investor. An investor could potentially lose all or more than the initial investment. Risk capital is money that can be lost without jeopardizing ones’ financial security or life style. Only risk capital should be used for trading and only those with sufficient risk capital should consider trading. Past performance is not necessarily indicative of future results.
Hypothetical Performance Disclosure: Hypothetical performance results have many inherent limitations, some of which are described below. no representation is being made that any account will or is likely to achieve profits or losses similar to those shown; in fact, there are frequently sharp differences between hypothetical performance results and the actual results subsequently achieved by any particular trading program. One of the limitations of hypothetical performance results is that they are generally prepared with the benefit of hindsight. In addition, hypothetical trading does not involve financial risk, and no hypothetical trading record can completely account for the impact of financial risk of actual trading. for example, the ability to withstand losses or to adhere to a particular trading program in spite of trading losses are material points which can also adversely affect actual trading results. There are numerous other factors related to the markets in general or to the implementation of any specific trading program which cannot be fully accounted for in the preparation of hypothetical performance results and all which can adversely affect trading results.
See more 'Legal Disclosures' in the bottom menu bar!