
Latest News
2022 Start working on a new website
BBS Trading Expert
Watch the Youtube BBS video and here is a crude oil trading example
Want to know more about:
AXIOM business books awards, bronze medal! Thank You!
No longer available!
Favorite articles in 2010, 11, 12, 14 and 2015 S&C Readers' Choice Awards.

AXIOM Business Books Awards, bronze medal.

Technical Analysis Candlestick charts Part 7
Trading in the Context of Price History
Would you be confident opening a short position with the bearish engulfing pattern, as shown in figure 6.22?
Special offer: "Capturing Profit with technical Analysis"
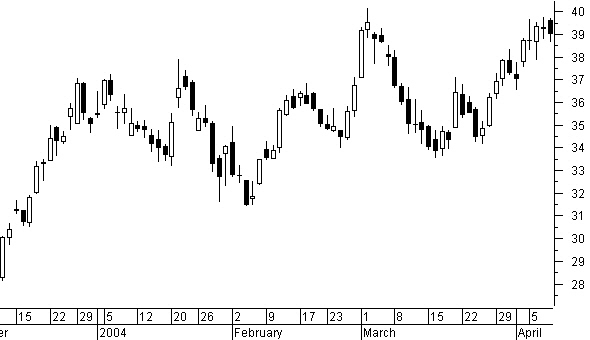
Figure 6.22: Would you open a short position with this bearish engulfing pattern?
YES! Despite the fact that there is no confirmation yet, you should not have any doubt about opening a short position here. The doji and the bearish engulfing pattern confirm the resistance of a previous evening star top from the beginning of March; therefore, a price reversal is almost certain. Additionally, you can open the position with a favorable risk-to-reward ratio, placing a stop at the top of the bearish engulfing or at the level of the previous top, which is almost the same.
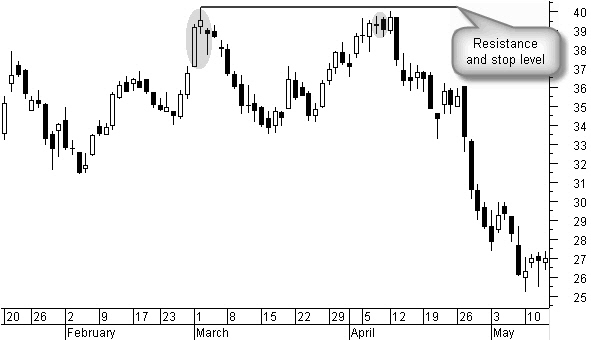
Figure 6.23: Confidence rewarded.
And the confidence was rewarded (figure 6.23)!
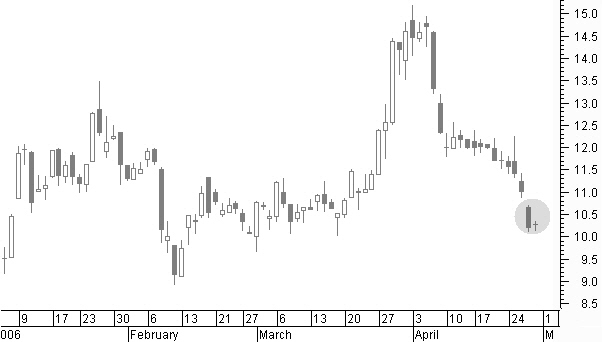
Figure 6.24: The last two days are a bullish harami cross. Is this a good buying moment?
In the chart shown in figure 6.24, the prices moved down considerably. The last two days make up a bullish harami cross. Is this a good buying moment?
NO! Right above the bullish harami cross, there is resistance from a falling window. If this resistance prevents an up-move now, the risk-to-reward ratio is not good. So, it will be much better to wait for the window to be broken before taking a position.
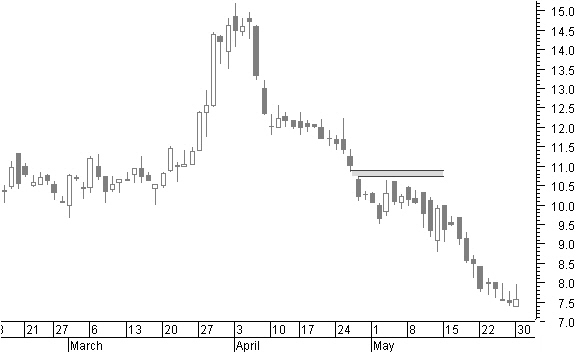
Figure 6.25: Price evolution confirmed it was better to wait!
Further price evolution confirmed that it was better to wait (figure 6.25).
The last three candles in figure 6.26 are a morning doji star. Should you buy here?
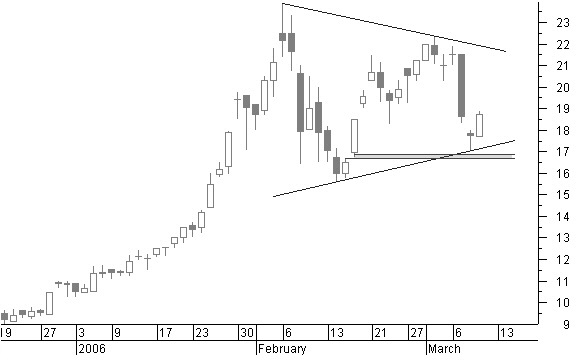
Figure 6.26: The last three candles are a morning doji star. Should you buy here?
YES! It does not look like an ideal morning doji star, but the third candle reaches just within the first candle and is very important for future resistance; the window between the first and second candles of the morning doji star is already closed by the third candle, so this window has no more meaning. The middle small hammer in the morning doji star confirms a previous window support from half of February; furthermore, you can see a symmetrical triangle price pattern, which mostly is a continuation pattern. Opening a position now, with a stop at the low side of the support window, and a primary price target calculated from the height of the start of the triangle and added to a breakout of the triangle, gives a very good risk-to-reward ratio. These are good reasons to open a position now!
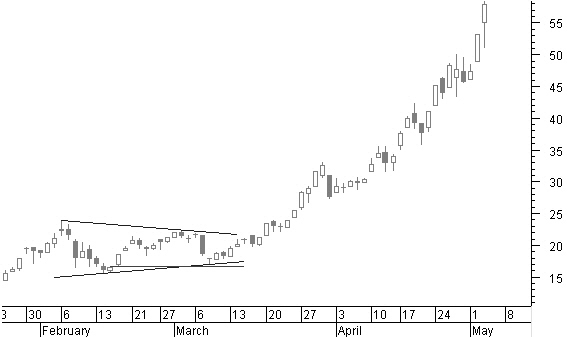
Good arguments made a good decision – figure 6.27
Candlestick Charts PREVIOUS -Part 1 -Part 2 -Part 3 -Part 4 -Part 5 -Part6 -Part7
STOCATA Stocks Technical Analysis HOME
Links
Find a Stock ticker symbol, enter the ticker and find a chart, news, fundamentals and historical quotes.
Risk Disclosure: Futures and forex trading contains substantial risk and is not for every investor. An investor could potentially lose all or more than the initial investment. Risk capital is money that can be lost without jeopardizing ones’ financial security or life style. Only risk capital should be used for trading and only those with sufficient risk capital should consider trading. Past performance is not necessarily indicative of future results.
Hypothetical Performance Disclosure: Hypothetical performance results have many inherent limitations, some of which are described below. no representation is being made that any account will or is likely to achieve profits or losses similar to those shown; in fact, there are frequently sharp differences between hypothetical performance results and the actual results subsequently achieved by any particular trading program. One of the limitations of hypothetical performance results is that they are generally prepared with the benefit of hindsight. In addition, hypothetical trading does not involve financial risk, and no hypothetical trading record can completely account for the impact of financial risk of actual trading. for example, the ability to withstand losses or to adhere to a particular trading program in spite of trading losses are material points which can also adversely affect actual trading results. There are numerous other factors related to the markets in general or to the implementation of any specific trading program which cannot be fully accounted for in the preparation of hypothetical performance results and all which can adversely affect trading results.
See more 'Legal Disclosures' in the bottom menu bar!