
Latest News
2022 Start working on a new website
BBS Trading Expert
Watch the Youtube BBS video and here is a crude oil trading example
Want to know more about:
AXIOM business books awards, bronze medal! Thank You!
No longer available!
Favorite articles in 2010, 11, 12, 14 and 2015 S&C Readers' Choice Awards.

AXIOM Business Books Awards, bronze medal.

Stocks Technical Analysis Indicators
These days, there are hundreds, and probably thousands, of indicators and oscillators, especially if you count the many indicators that have been developed solely for personal use. We will strictly limit the overview here to indicators used by myself.
Special offer: "Capturing Profit with technical Analysis"
RSI (Relative Strength Index)
The RSI indicator I use as part of the decision process to open or close a position. Divergence signals between price and RSI are a trade confirmation when other buy or sell signals are present. On the other hand, an overbought or oversold RSI can help to hold on to the position when selling signals appear, that way avoiding unnecessary closing of the position.
I use a standard RSI with a dynamic reference level.
The Relative Strength Index (RSI) is a popular momentum oscillator. Momentum refers to the speed of change; oscillator means that the value of the RSI moves (oscillates) between two values (0 and 100). The RSI was introduced by J. Welles Wilder in New Concepts in Technical Trading Systems.
The term “relative strength” might sound a little confusing because it does not compare the relative strength between stocks; rather, it compares the actual price with past prices.
For the application and estimation of price evolution I primarily look at divergences between the RSI and the price bars.
The Formula
 Meaning:
U = Averaged sum of the prices when the closing price was higher (compared to the previous bar) in the period used.
D = Averaged sum of the prices when the closing price was lower (compared to the previous bar) in the period used.
Within the time period used, RSI measures the relation between the price bars with a higher closing price compared to the previous bar, and between the bars with a lower closing price compared to the previous price bar.
Originally, Wilder used a 14-day period on daily charts; this remains the standard and most widely used value today.
The RSI is a leading indicator.
Tops and bottoms will be visible in the RSI before they show on the price chart.
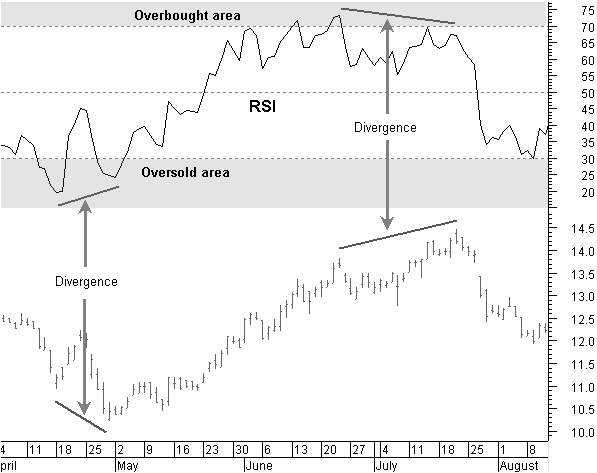
Figure 5.1: RSI divergences and overbought and oversold areas.
The standard 14-period RSI makes tops above 70 and is called the overbought area; when it bottoms below 30, it is called the oversold area (figure 5.1).
These tops and bottoms show up in the RSI before there are tops or bottoms visible on the price chart; however, a continuing uptrend or downtrend will keep the RSI in the overbought or oversold zone.
Convergence and Divergence
When tops or bottoms of a stock price and an oscillator move in the same direction it’s known as convergence. When price and oscillator tops or bottoms move in opposite directions, it’s known as a divergence.
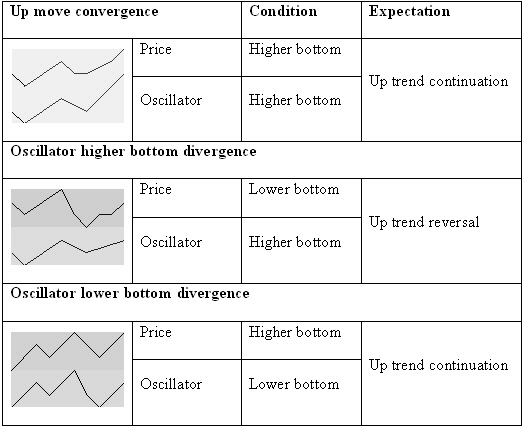
Figure 5.2: Basic bottom convergence and divergence.
In looking at the lows of the oscillator and comparing them with the lows in price, we can define three different situations (see figure 5.2):
- When the price and oscillator make higher or equal bottoms, they converge. Until there is no other indication, the most probable price move is a continuation of the uptrend.
- When the oscillator creates a higher bottom while the price makes a lower bottom, they diverge. This is mostly found at the end of a downtrend, indicating an uptrend reversal.
- When the oscillator has a lower bottom while the price sets a higher bottom, they diverge. This is mostly found in a price uptrend after a price correction, indicating a continuation of the uptrend.
Simply looking at bottoms, we can say that the price is going to move up if there is a divergence between the price and the oscillator or if the price and the oscillator bottoms converge in an uptrend.
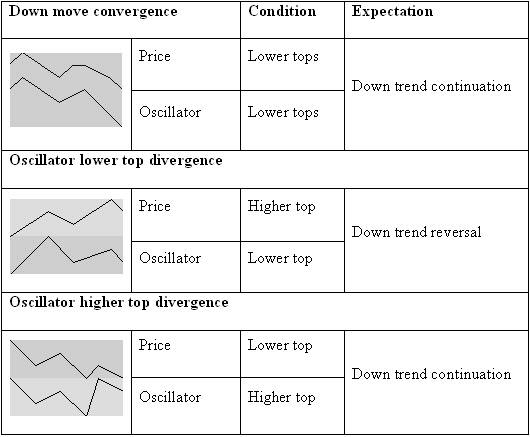
Figure 5.3: Basic top convergence and divergence.
Looking at the highs of the oscillator and comparing them with highs in price, we can define three other situations (see Figure 5.3):
- When the price and the oscillator make equal or lower tops, they converge. Until there is no other indication, the most probable price move is a continuation of the downtrend.
- When the oscillator makes a lower top while price makes a higher top, they diverge. This is mostly found at the end of an uptrend, indicating a downtrend reversal.
- When the oscillator makes a higher top while price makes a lower top, they diverge. This is usually found in a price downtrend after a price up correction, indicating a continuation of the downtrend.
Just by looking at the tops, you can say that the price will move down if there is a divergence between the price and the oscillator or if the price and the oscillator tops converge in a downtrend.
Divergences are reliable indications for predicting trend reversals.
A divergence with a higher bottom in the RSI indicator and a lower bottom on the price chart is an indicator for an uptrend reversal . On the other hand, a divergence with a higher top in the price chart and a lower top in the RSI indicator points to a downtrend reversal (figure 5.1).
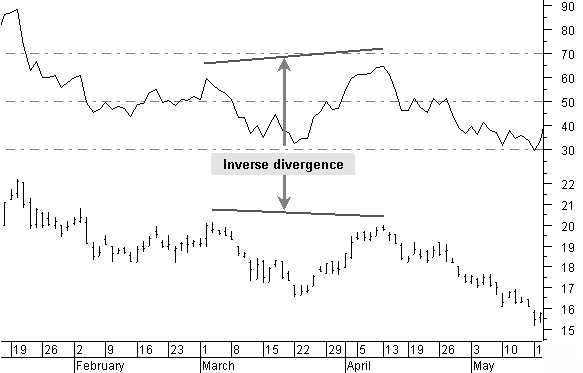
Figure 5.4: Inverse divergence with a higher top in the RSI and a lower top in price.
Figure 5.4 is an inverse divergence with a higher top in the RSI and a lower top in price. This is most common in a downtrend when there is a temporary up-correction in that downtrend, and the price is making a lower top while the RSI is making a higher top. This is an indication that the price is reversing and will continue the previous downtrend.
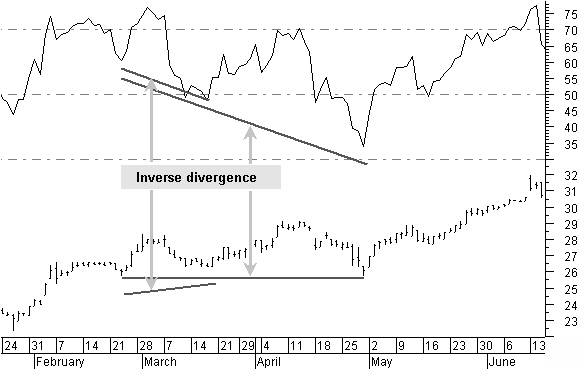
Figure 5.5: Inverse divergence with lower RSI bottom and a higher or equal price bottom.
Figure 5.5 shows an inverse divergence with a lower RSI bottom and a higher or equal price bottom. It is more common in an uptrend when temporary downward corrections end with a higher price bottom while having a lower bottom in the RSI.
This is a signal that the price is reversing and will continue the previous uptrend.
Stocks Technical Analysis Indicators Next -Part 1 -Part 2 -Part 3 -Part 4 -Part 5
STOCATA Stocks Technical Analysis HOME
Links
Find a Stock ticker symbol, enter the ticker and find a chart, news, fundamentals and historical quotes.
Risk Disclosure: Futures and forex trading contains substantial risk and is not for every investor. An investor could potentially lose all or more than the initial investment. Risk capital is money that can be lost without jeopardizing ones’ financial security or life style. Only risk capital should be used for trading and only those with sufficient risk capital should consider trading. Past performance is not necessarily indicative of future results.
Hypothetical Performance Disclosure: Hypothetical performance results have many inherent limitations, some of which are described below. no representation is being made that any account will or is likely to achieve profits or losses similar to those shown; in fact, there are frequently sharp differences between hypothetical performance results and the actual results subsequently achieved by any particular trading program. One of the limitations of hypothetical performance results is that they are generally prepared with the benefit of hindsight. In addition, hypothetical trading does not involve financial risk, and no hypothetical trading record can completely account for the impact of financial risk of actual trading. for example, the ability to withstand losses or to adhere to a particular trading program in spite of trading losses are material points which can also adversely affect actual trading results. There are numerous other factors related to the markets in general or to the implementation of any specific trading program which cannot be fully accounted for in the preparation of hypothetical performance results and all which can adversely affect trading results.
See more 'Legal Disclosures' in the bottom menu bar!