
Latest News
2022 Start working on a new website
BBS Trading Expert
Watch the Youtube BBS video and here is a crude oil trading example
Want to know more about:
AXIOM business books awards, bronze medal! Thank You!
No longer available!
Favorite articles in 2010, 11, 12, 14 and 2015 S&C Readers' Choice Awards.

AXIOM Business Books Awards, bronze medal.

Stocks Technical Analysis Indicators Part 3
Heikin-Ashi Price Bars
Heikin-ashi, Japanese for “average bar,” is a technique used to better visualize price trends by recalculating candlesticks. (Dan Valcu [2004]. “Using the Heikin-Ashi Technique,” Technical Analysis of STOCKS & COMMODITIES, Volume 22: February 2004).
Special offer: "Capturing Profit with technical Analysis"
Calculating the New Candle
- HaClose = (Open+High+Low+Close)/4
= the average price of the current bar - HaOpen = [HaOpen(previous bar) + Close(previous bar)]/2
= the midpoint of the previous bar - HaHigh = Max(High, HaOpen, HaClose)
= the highest value in the range - HaLow = Min(Low, HaOpen, HaClose)
= the lowest value in the range
Heikin-Ashi Chart
The heikin-ashi chart is a candle chart based on the recalculated values for open, high, low, and closing prices, but with a different interpretation.
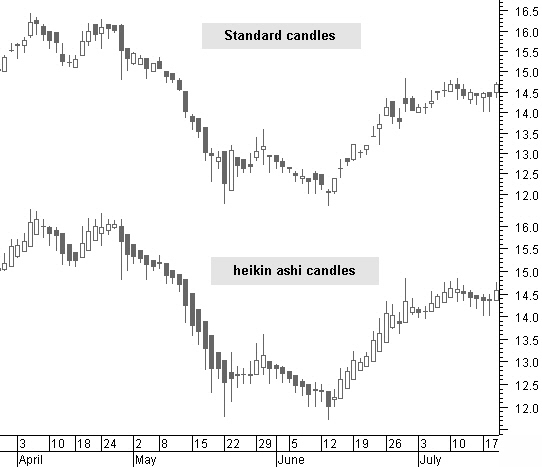
Figure 5.10: At the top the standard candle chart and below the heikin-ashi candle chart.
At the top of figure 5.10, the standard candle chart, based on the real open, high, low, and closing prices. Below, the heikin-ashi candle chart, based on the re-calculated prices for open, high, low, and closing prices.
Interpretation of heikin-ashi candles:
Sce-nario |
Trend |
Actual trend |
|
|
|
Uptrend |
Down trend |
1 |
Normal trend |
Up-moving white bodies |
Down-moving black bodies |
2 |
Strong trend |
Up-moving white bodies without a lower shadow |
Down-moving black bodies without an upper shadow |
3 |
Weakening trend |
Bodies are getting smaller; lower shadows are appearing |
Bodies are getting smaller; upper shadows are appearing |
4 |
Consolidation |
Small bodies with upper and lower shadows |
Small bodies with upper and lower shadows |
5 |
Trend reversal |
Small bodies with big upper and lower shadows (not always reliable) |
Small bodies with big upper and lower shadows (not always reliable) |
heikin-ashi Candles in MetaStock®
In MetaStock, it is not possible to create an indicator that will result in more than one data item displayed on a single bar. For heikin-ashi candles, however, you need four data items displayed on the same bar.
If you really want to use heikin-ashi candle charts, it is best to buy conversion software that can automatically convert the data and then create a mirror of the data in heikin-ashi format.
“HeikinAshi4MetaStock” is a shareware program that does this; it is easy to find on the Internet.
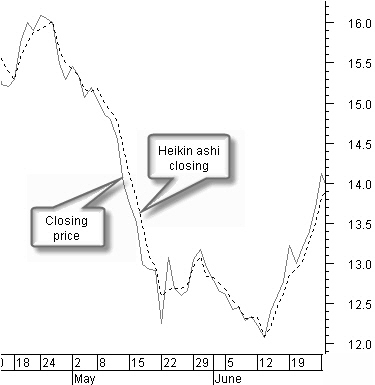
In our LOCKIT application, we only use the average of the heikin-ashi closing price because it has a very good smoothing effect without lag, as you can see in figure 5.11.
Figure 5.11: Good smoothing effect of the heikin-ashi closing price average.
HA_C Calculation formula for the average heikin-ashi closing price:
{haC}
haOpen:=(Ref((O+H+L+C)/4,-1) + PREV)/2;
haC:=((O+H+L+C)/4+haOpen+Max(H,haOpen)+Min(L,haOpen))/4;
haC
Stocks Technical Analysis Indicators Next -Previous -Part 1 -Part 2 -Part 3 -Part 4 -Part 5
STOCATA Stocks Technical Analysis HOME
Links
Find a Stock ticker symbol, enter the ticker and find a chart, news, fundamentals and historical quotes.
Risk Disclosure: Futures and forex trading contains substantial risk and is not for every investor. An investor could potentially lose all or more than the initial investment. Risk capital is money that can be lost without jeopardizing ones’ financial security or life style. Only risk capital should be used for trading and only those with sufficient risk capital should consider trading. Past performance is not necessarily indicative of future results.
Hypothetical Performance Disclosure: Hypothetical performance results have many inherent limitations, some of which are described below. no representation is being made that any account will or is likely to achieve profits or losses similar to those shown; in fact, there are frequently sharp differences between hypothetical performance results and the actual results subsequently achieved by any particular trading program. One of the limitations of hypothetical performance results is that they are generally prepared with the benefit of hindsight. In addition, hypothetical trading does not involve financial risk, and no hypothetical trading record can completely account for the impact of financial risk of actual trading. for example, the ability to withstand losses or to adhere to a particular trading program in spite of trading losses are material points which can also adversely affect actual trading results. There are numerous other factors related to the markets in general or to the implementation of any specific trading program which cannot be fully accounted for in the preparation of hypothetical performance results and all which can adversely affect trading results.
See more 'Legal Disclosures' in the bottom menu bar!