
Latest News
2022 Start working on a new website
BBS Trading Expert
Watch the Youtube BBS video and here is a crude oil trading example
Want to know more about:
AXIOM business books awards, bronze medal! Thank You!
No longer available!
Favorite articles in 2010, 11, 12, 14 and 2015 S&C Readers' Choice Awards.

AXIOM Business Books Awards, bronze medal.

Stocks Technical Analysis Indicators Part 2
RSI (Continued)
Reference Level
The 30-70 fixed reference level used in the standard RSI is a disadvantage if you are using time periods other than the standard 14 bars.
Special offer: "Capturing Profit with technical Analysis"
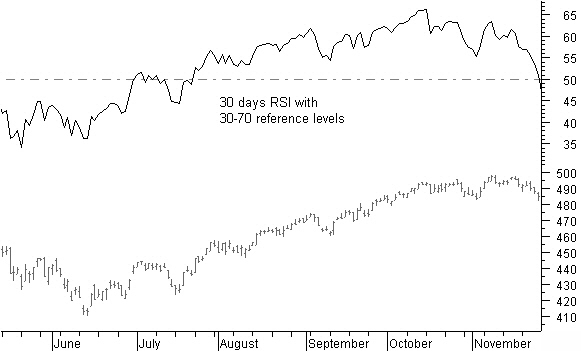
Figure 5.6: Using an RSI 30 bars average, 30 and 70 levels are not reached anymore.
If you used a 30-bar reference, as shown in figure 5.6, you would notice that the 30-70 levels are not reached anymore.
We can solve this by using a variable reference level.
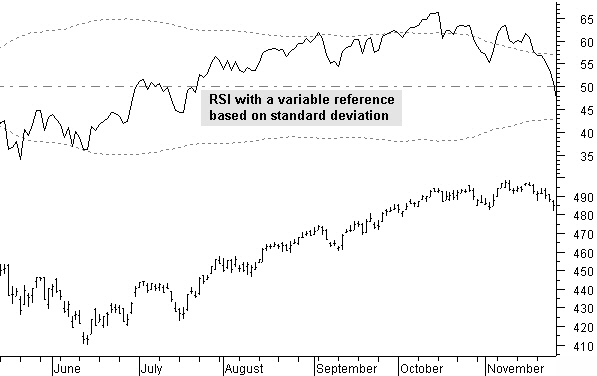
Figure 5.7: RSI with a standard deviation reference level.
In figure 5.7, you see a simple way of achieving this by using a standard-deviation value referenced to the RSI 50 level in a predefined look-back period.
We set the upper standard deviation to a value of 50 plus 1.5 times the standard deviation over a 100-day look-back period.
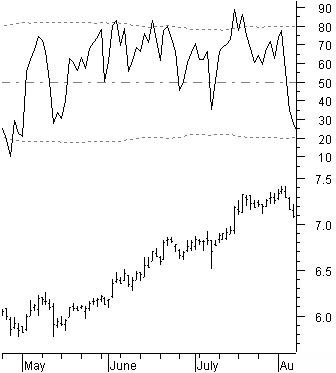
This is demonstrated in figure 5.8 with a 5-bar RSI.
For bigger RSI time periods, the reference level moves closer to the 50 level, whereas for smaller periods, like our 5-day RSI example, reference levels move farther away to the 20 and 80 levels.
Figure 5.8: Lower and upper reference set to 1.5 standard deviations for a 5 period RSI.
The RSI custom formula with the variable standard deviation lines is as follows:
{SVERSIStDev}
period:= Input("RSI period?",1,100,14);
afwh:= Input("Standard deviation high side",0.1,5,1.5);
afwl:= Input("Standard deviation Low side",0.1,5,1.5);
afwper:= Input("Standard deviation period ",1,200,100);
SVERSIStDev:=RSI(C,period);
50+afwh*Stdev(SVERSIStDev,afwper);
50-afwl*Stdev(SVERSIStDev,afwper);
SVERSIStDev
M- and W-shaped Patterns
M- and W-shaped patterns are short time patterns visible in the overbought or oversold areas of the RSI indicator.
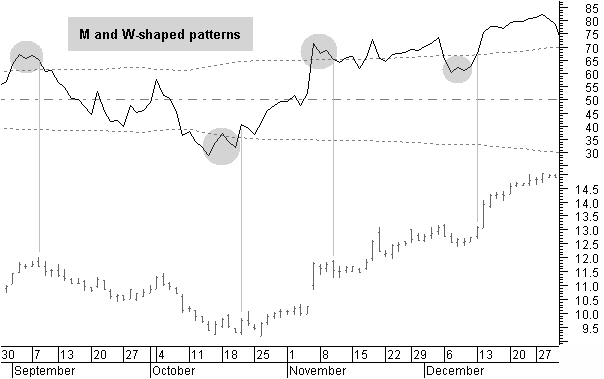
Figure 5.9: M-shaped top and W-shaped bottom patterns are short term reversal signals.
Figure 5.9 shows small M-shaped patterns at the top and small W-shaped patterns at the bottom that give reliable short-term price reversal signals. Preferably, they’ll incline in the direction of the reversal.
The second leg of the M-shaped pattern does not move above the first leg. The second leg of the W-shaped pattern does not move below the first leg. M and W patterns are unrelated to convergences or divergences between the price and RSI indicator. They are more useful when there is convergence because they are, at that moment in time, the only visible indicators of, at least, a short-term reversal.
Stocks Technical Analysis Indicators Next -Previous -Part 1 -Part 2 -Part 3 -Part 4 -Part 5
STOCATA Stocks Technical Analysis HOME
Links
Find a Stock ticker symbol, enter the ticker and find a chart, news, fundamentals and historical quotes.
Risk Disclosure: Futures and forex trading contains substantial risk and is not for every investor. An investor could potentially lose all or more than the initial investment. Risk capital is money that can be lost without jeopardizing ones’ financial security or life style. Only risk capital should be used for trading and only those with sufficient risk capital should consider trading. Past performance is not necessarily indicative of future results.
Hypothetical Performance Disclosure: Hypothetical performance results have many inherent limitations, some of which are described below. no representation is being made that any account will or is likely to achieve profits or losses similar to those shown; in fact, there are frequently sharp differences between hypothetical performance results and the actual results subsequently achieved by any particular trading program. One of the limitations of hypothetical performance results is that they are generally prepared with the benefit of hindsight. In addition, hypothetical trading does not involve financial risk, and no hypothetical trading record can completely account for the impact of financial risk of actual trading. for example, the ability to withstand losses or to adhere to a particular trading program in spite of trading losses are material points which can also adversely affect actual trading results. There are numerous other factors related to the markets in general or to the implementation of any specific trading program which cannot be fully accounted for in the preparation of hypothetical performance results and all which can adversely affect trading results.
See more 'Legal Disclosures' in the bottom menu bar!