
Latest News
2022 Start working on a new website
BBS Trading Expert
Watch the Youtube BBS video and here is a crude oil trading example
Want to know more about:
AXIOM business books awards, bronze medal! Thank You!
No longer available!
Favorite articles in 2010, 11, 12, 14 and 2015 S&C Readers' Choice Awards.

AXIOM Business Books Awards, bronze medal.

Stocks Technical Analysis Indicators Part 5
Bollinger %b Oscillator
Bollinger Bands were created by John Bollinger and are described in his book “Bollinger on Bollinger Bands”.
Special offer: "Capturing Profit with technical Analysis"
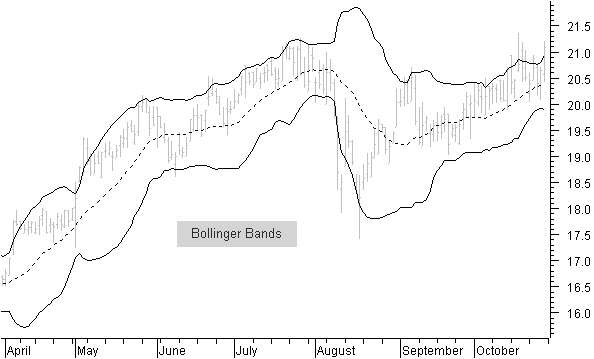
Figure 5.13: Bollinger Bands consist of three curves drawn in relation to price data.
The Bollinger Bands in figure 5.13 consist of a set of three curves drawn in relation to price data. The middle band usually is a simple 20-bar moving average, which serves as the base for the upper and lower bands.
Middle Bollinger Band = 20-period simple moving average
Upper Bollinger Band = Middle Bollinger Band + 2 * 20-period standard deviation
Lower Bollinger Band = Middle Bollinger Band - 2 * 20-period standard deviation
The use of standard-deviation bands is a method to measure price volatility.
With trending prices, the bands will be wider as a result of the higher volatility in price, whereas consolidation-period bands will be narrower as a result of smaller price moves.
I am not using Bollinger bands; instead, I use %b, a measure of where the last price is in relation to the bands.
Bandwidth is used for volatility-based trading opportunities; %b is strongly influenced by volatility, and we use it as an oscillator to show overbought and oversold situations, preferably looking at divergences.
We do not get the best %b indicator by using closing prices, but by using heikin-ashi average closing prices. We also are not using a simple moving average, but a weighted moving average for a faster short-term response.
This is the MetaStock® formula for the heikin-ashi Bollinger Bands %b indicator:
We call this function SVE_BB%b_HA:
{SVE_BB%b_HA}
peri:=Input("Average period: ",2,100,18);
haOpen:=(Ref((O+H+L+C)/4,-1) + PREV)/2;
haC:=((O+H+L+C)/4+haOpen+Max(H,haOpen)+Min(L,haOpen))/4;
SVE_BB%b_HA:=((haC+2*Stdev(haC,peri)-Mov(haC,peri,W))/(4*Stdev(haC,peri)))*100;
SVE_BB%b_HA
I use standard an 18-bar SVE_BB%b_HA.
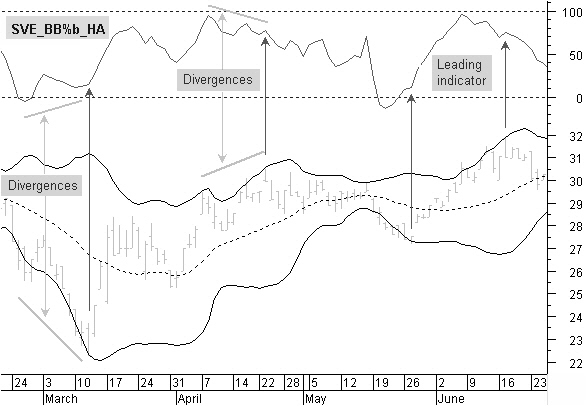
Figure 5.14: SVE_BB%b_HA leading indicator.
As you can see in figure 5.14, the indicator is leading most of the time, showing high levels, low levels, and divergences prior to turning points in price movement.
It is a fast and useful indicator used in combination with the other indicators.
Stocks Technical Analysis Indicators PREVIOUS -Part 1 -Part 2 -Part 3 -Part 4 -Part 5
STOCATA Stocks Technical Analysis HOME
Links
Find a Stock ticker symbol, enter the ticker and find a chart, news, fundamentals and historical quotes.
Risk Disclosure: Futures and forex trading contains substantial risk and is not for every investor. An investor could potentially lose all or more than the initial investment. Risk capital is money that can be lost without jeopardizing ones’ financial security or life style. Only risk capital should be used for trading and only those with sufficient risk capital should consider trading. Past performance is not necessarily indicative of future results.
Hypothetical Performance Disclosure: Hypothetical performance results have many inherent limitations, some of which are described below. no representation is being made that any account will or is likely to achieve profits or losses similar to those shown; in fact, there are frequently sharp differences between hypothetical performance results and the actual results subsequently achieved by any particular trading program. One of the limitations of hypothetical performance results is that they are generally prepared with the benefit of hindsight. In addition, hypothetical trading does not involve financial risk, and no hypothetical trading record can completely account for the impact of financial risk of actual trading. for example, the ability to withstand losses or to adhere to a particular trading program in spite of trading losses are material points which can also adversely affect actual trading results. There are numerous other factors related to the markets in general or to the implementation of any specific trading program which cannot be fully accounted for in the preparation of hypothetical performance results and all which can adversely affect trading results.
See more 'Legal Disclosures' in the bottom menu bar!