
Latest News
2022 Start working on a new website
BBS Trading Expert
Watch the Youtube BBS video and here is a crude oil trading example
Want to know more about:
AXIOM business books awards, bronze medal! Thank You!
No longer available!
Favorite articles in 2010, 11, 12, 14 and 2015 S&C Readers' Choice Awards.

AXIOM Business Books Awards, bronze medal.

Technical Analysis Elliott Waves
One of the only tools that can give you an idea in which direction the stock price is going to move next, is the use of Elliott waves.
With short, medium and long term Elliott waves trend analysis we can have a pretty good indication if price has a better chance going up or going down in those different periods. In addition it can give us price targets.
Special offer: "Capturing Profit with technical Analysis"
Your Elliott wave count does not have to be perfect. You most probably will have to review counts regularly. What is important at the end is that when you expect an up move, price makes an up move.
In my book "Capturing Profit with Technical Analysis", there is a small tool that will help you making Elliott wave counts.
Introduction
During an illness in the mid-1930s, Ralph Nelson Elliott discovered the correlation between human emotion and trend patterns contained within price charts.
Elliott discovered different patterns that repeated themselves in form but not necessarily in size or length of time; these patterns could always be subdivided into smaller waves within the framework of certain rules. He called this phenomenon the “wave principle.”
There are two basic waves in Elliott wave theory: a five-wave impulse pattern in the direction of the main trend and a three-wave correction pattern against the main trend.
In a later stage, Elliott used Fibonacci numbers together with the waves to predict target prices.
The Elliott wave principle gained wide attention in the 20th century during the 70s thanks Frost and Prechter, who published the legendary book, Elliott Wave Principle: Key to Stock Market Profits, 1978. During the economic crisis of the seventies, this book forecasted the big bull market of the eighties.
Impulse and Correction Waves
A trend signals the main direction in which prices are moving; corrections move either against the main trend or sideways.
In Elliott wave terminology, these are called impulse waves and correction waves.
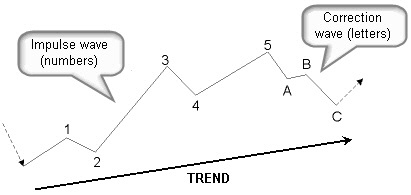
Figure 7.1: An impulse wave consists of five waves.
In figure 7.1, you can see that an impulse wave consists of five waves: three in the direction of the trend (waves 1, 3, and 5) and two against the trend (waves 2 and 4).
The correction wave consists of three waves: A, B, and C. Impulse waves are identified by numbers; correction waves are identified by letters.
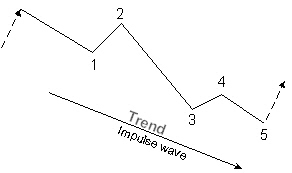
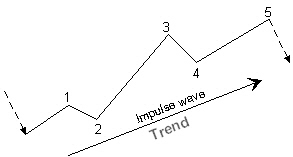
Figure 7.2: Impulse wave in a downtrend. Figure 7.3: Impulse wave in an uptrend.
Figure 7.2 is an impulse wave in a downtrend and figure 7.3 is an impulse wave in an uptrend.
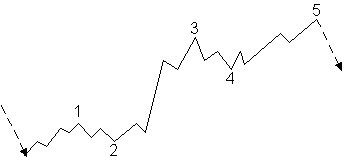
Figure 7.4: Waves 1-3-5 in the direction of the trend.
In figure 7.4, waves 1, 3, and 5 moving in the direction of the trend are impulse waves and, therefore, consist of another impulse wave of a lower degree.
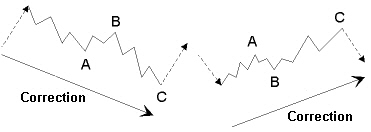
Figure 7.5: 3-wave correction waves in an uptrend and in a downtrend.
Figure 7.5 shows correction waves in an uptrend and in a downtrend. The correction wave has three waves. Waves A and C point in the direction of the correction; wave B is moving against this direction. Waves 2 and 4 in an impulse wave also are correction waves. Waves A and C in a correction wave move in the direction of the correction trend and are therefore impulse waves, again consisting of five waves.
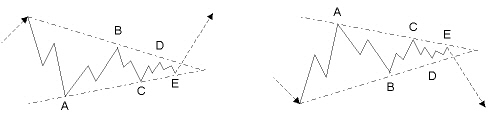
Figure 7.6: 5-wave triangle corrections in an uptrend and in a downtrend.
Figure 7.6 shows triangle corrections in an uptrend and in a downtrend. A triangle correction consists of five waves.
IMPORTANT! A triangle correction is part of an ABC correction wave.
Elliott Waves Next -Part 1 -Part 2 -Part 3 -Part 4 -Part 5 -Part 6 -Part 7
STOCATA Stocks Technical Analysis HOME
Links
Find a Stock ticker symbol, enter the ticker and find a chart, news, fundamentals and historical quotes.
Risk Disclosure: Futures and forex trading contains substantial risk and is not for every investor. An investor could potentially lose all or more than the initial investment. Risk capital is money that can be lost without jeopardizing ones’ financial security or life style. Only risk capital should be used for trading and only those with sufficient risk capital should consider trading. Past performance is not necessarily indicative of future results.
Hypothetical Performance Disclosure: Hypothetical performance results have many inherent limitations, some of which are described below. no representation is being made that any account will or is likely to achieve profits or losses similar to those shown; in fact, there are frequently sharp differences between hypothetical performance results and the actual results subsequently achieved by any particular trading program. One of the limitations of hypothetical performance results is that they are generally prepared with the benefit of hindsight. In addition, hypothetical trading does not involve financial risk, and no hypothetical trading record can completely account for the impact of financial risk of actual trading. for example, the ability to withstand losses or to adhere to a particular trading program in spite of trading losses are material points which can also adversely affect actual trading results. There are numerous other factors related to the markets in general or to the implementation of any specific trading program which cannot be fully accounted for in the preparation of hypothetical performance results and all which can adversely affect trading results.
See more 'Legal Disclosures' in the bottom menu bar!