
Latest News
2022 Start working on a new website
BBS Trading Expert
Watch the Youtube BBS video and here is a crude oil trading example
Want to know more about:
AXIOM business books awards, bronze medal! Thank You!
No longer available!
Favorite articles in 2010, 11, 12, 14 and 2015 S&C Readers' Choice Awards.

AXIOM Business Books Awards, bronze medal.

Technical Analysis Elliott Waves Part 3
Starting Wedge Impulse Wave
The starting wedge impulse wave can only appear in waves 1 or A.
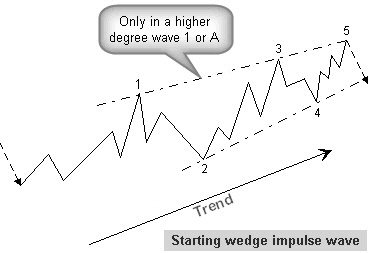
Figure 7.16: Starting wedge impulse wave.
Special offer: "Capturing Profit with technical Analysis"
In figure 7.16, there may be, at first, some confusion when waves 3 and 4, within the starting wedge impulse wave, are seen as the start of an extension waves 1 and 2.
You must recognize the starting wedge impulse wave at the start of wave 5 by drawing the wedge pattern.
You know now that the starting wedge impulse wave 5 is really just the top of wave 1 of a higher order wave. The wave that follows is not an extended impulse wave 3, but a correction wave 2.
Rules and Guidelines
- This pattern has 5 waves.
- The price is moving between 2 converging lines, a wedge pattern.
- Wave 1 is an impulse wave or a lower order starting wedge impulse wave.
- Wave 2 is any correction pattern, except a triangle.
- Wave 2 is always smaller than wave 1.
- Wave 3 is an impulse pattern.
- Wave 3 is always bigger than wave 2.
- Wave 3 is never the smallest wave compared to waves 1 or 5.
- Wave 4 can be any correction pattern.
- Waves 4 and 2 are partly overlapping.
- Wave 5 is an impulse pattern or an ending wedge impulse wave.
- Wave 5 is a minimum 50% of the size of wave 4.
The 5 waves of a starting wedge impulse wave have a 5-3-5-3-5 structure.
Example CXP (Corporate Express):
Figure 7.17 is a wave 1 starting wedge impulse wave, starting a new rising trend.
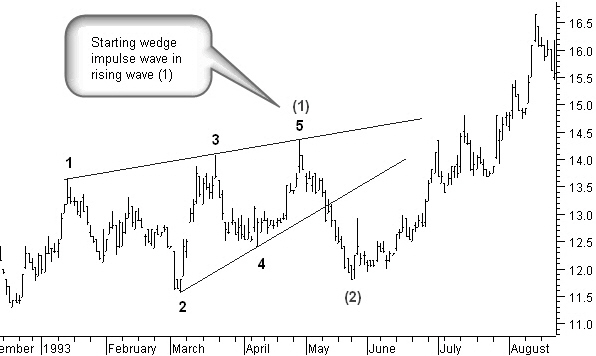
Figure 7.17: Corporate Express, starting wedge impulse wave example.
Ending Wedge Impulse Wave
Ending wedge impulse waves are rare in high order impulse waves. They mostly are found in lower order impulse waves. Because the ending wedge impulse wave is a 5 impulse wave or a wave C correction wave, there will be a market reversal on wave completion.
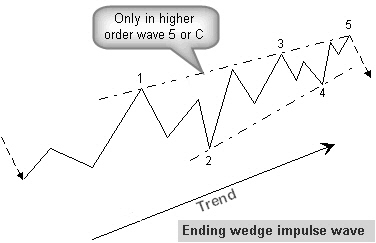
Figure 7.18: Ending wedge impulse wave.
Figure 7.18 shows an ending wedge impulse wave that can be found in impulse wave 5 or correction wave C.
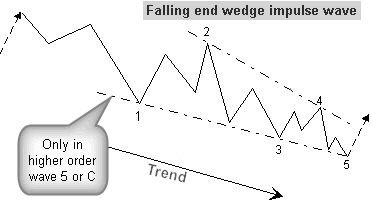
Figure 7.19: Descending ending wedge impulse wave.
Figure 7.19 shows a descending ending wedge impulse wave.
At first, there may be some confusion when waves 3 and 4, within the ending wedge impulse wave, are seen as the start of extension waves 1 and 2. It is important to recognize the ending wedge impulse wave at the start of wave 5 by drawing the wedge pattern.
You know now that the ending wedge impulse wave 5 is really the end of wave 5 of a higher order wave.
The wave that follows is not an extended impulse wave 3, but a bigger correction wave.
The ending wedge impulse wave can be easily recognized by the internal 3-3-3-3-3 structure.
Rules and Guidelines
- This pattern consists of 5 waves.
- The price is moving between two converging lines, a wedge pattern.
- Waves 1, 3, and 5 are zigzag patterns.
- Wave 2 is any correction pattern, except a triangle.
- Wave 2 is always smaller than wave 1.
- Wave 3 is always bigger than wave 2.
- Wave 3 is never the smallest wave compared to waves 1 or 5.
- Wave 4 can be any correction pattern.
- Waves 4 and 2 are partly overlapping.
- Wave 5 is a minimum 50% of the size of wave 4.
The 5 waves of an ending wedge impulse wave have a 3-3-3-3-3 structure.
Example AAI (Airtran Holdings Inc):
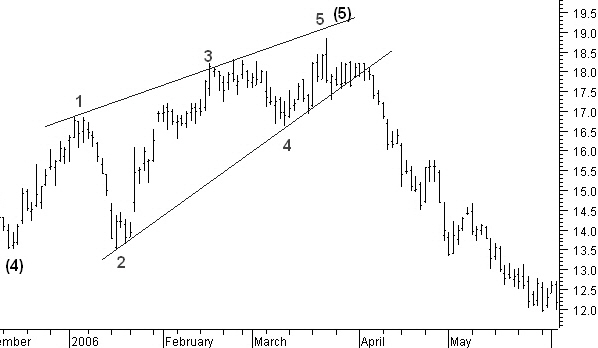
Figure 7.20: Airtran Holdings, an example of an ascending ending wedge impulse wave.
Figure 7.20 is an example of an ascending ending wedge impulse wave.
Elliott Waves Next -Previous -Part 1 -Part 2 -Part 3 -Part 4 -Part 5 -Part 6 -Part 7
STOCATA Stocks Technical Analysis HOME
Links
Find a Stock ticker symbol, enter the ticker and find a chart, news, fundamentals and historical quotes.
Risk Disclosure: Futures and forex trading contains substantial risk and is not for every investor. An investor could potentially lose all or more than the initial investment. Risk capital is money that can be lost without jeopardizing ones’ financial security or life style. Only risk capital should be used for trading and only those with sufficient risk capital should consider trading. Past performance is not necessarily indicative of future results.
Hypothetical Performance Disclosure: Hypothetical performance results have many inherent limitations, some of which are described below. no representation is being made that any account will or is likely to achieve profits or losses similar to those shown; in fact, there are frequently sharp differences between hypothetical performance results and the actual results subsequently achieved by any particular trading program. One of the limitations of hypothetical performance results is that they are generally prepared with the benefit of hindsight. In addition, hypothetical trading does not involve financial risk, and no hypothetical trading record can completely account for the impact of financial risk of actual trading. for example, the ability to withstand losses or to adhere to a particular trading program in spite of trading losses are material points which can also adversely affect actual trading results. There are numerous other factors related to the markets in general or to the implementation of any specific trading program which cannot be fully accounted for in the preparation of hypothetical performance results and all which can adversely affect trading results.
See more 'Legal Disclosures' in the bottom menu bar!