
Latest News
2022 Start working on a new website
BBS Trading Expert
Watch the Youtube BBS video and here is a crude oil trading example
Want to know more about:
AXIOM business books awards, bronze medal! Thank You!
No longer available!
Favorite articles in 2010, 11, 12, 14 and 2015 S&C Readers' Choice Awards.

AXIOM Business Books Awards, bronze medal.

Technical Analysis Elliott Waves Part 2
The Correct Count
 Any impulse wave can be interpreted as a correction wave, but it is, of course, wrong to do this because the Elliot wave count will be completely wrong.
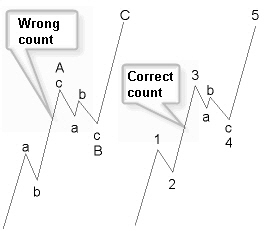
In figure 7.9, a longer 3 wave, followed by a 4 wave with an endpoint above the top of wave 1, must be labeled as an impulse wave.
When you mark wave 3 as an A wave, consisting of sub-waves abc, you would next expect a flat correction, with a B wave falling back in the neighborhood of the wave A start. This is clearly not the case here. Respecting all the rules is important.
Figure 7.9: Correctly counting waves.
Special offer: "Capturing Profit with technical Analysis"
Number of Waves in a Cycle
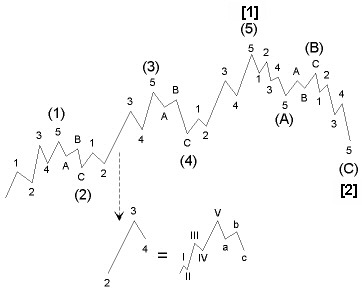
Figure 7.10: Number of waves in a cycle.
An impulse wave and a correction wave together make a cycle (figure 7.10).
Biggest wave: [1] to [2] consist of 1 + 1 = 2 waves
Biggest subdivision: (1) to (C) consist of 5 + 3 = 8 waves
Next subdivision: 1 to C consist of 21 + 13 = 34 waves
Next subdivision: I to c consist of 89 + 55 = 144 waves
This subdivision is not limited.
Waves Subdivisions
The basic rule in Elliott wave theory is that wave structures of a higher order are composed of sub-waves of a lower order, which, in turn, are composed of smaller order sub-waves, and so on. They all have, more or less, the same structure as the bigger wave they belong to, impulse or correction.
Elliott used nine subdivisions, varying in length from two centuries to one hour prior.
In the next table, we use our own subdivision ordered by time.
The timing used gives an idea about what kind of period we are looking at, but it is not binding.
Subdivision |
Time |
Impulse |
Correction |
|
|
|
|
Grand Super cycle |
> 30 years |
[I] … [V] |
[A] … [C] |
Super cycle |
Decades |
(I)…(V) |
(A)…(C) |
Cycle |
Decade |
I…V |
A…C |
Primary |
Years |
[1]…[5] |
[A]… [C] |
Intermediate |
Months |
(1)…(5) |
(a)…(c) |
Minor |
Weeks |
1…5 |
A…C |
Minute |
Days |
i…v |
a…c |
Minuet |
Hours |
1…5 |
a…c |
Sub minuet |
Minutes |
I…V |
A…C |
Impulse Patterns
Impulse Wave
Recognizing wave patterns is the most important occupation within Elliot wave analysis.
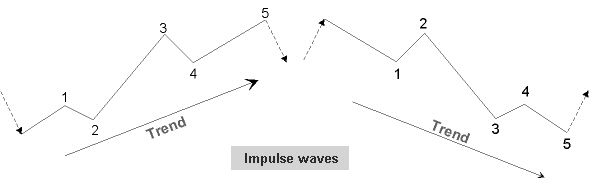
Figure 7.11: 5-wave impulse waves in an uptrend and a downtrend.
An impulse wave (figure 7.11) is always composed of 5 waves, numbered 1, 2, 3, 4, and 5. Waves 1, 3, and 5 are, again, impulse patterns. Waves 2 and 4 are correction patterns.
Rules and Guidelines
The following are the most important rules and guidelines for an impulse pattern.
- Wave 1 is an impulse wave or a starting wedge impulse wave.
- Wave 2 can be any type of correction pattern, except a triangle.
- Wave 2 cannot move beyond the start of wave 1.
- Wave 3 is an impulse wave.
- Wave 3 has a bigger price move than wave 2.
- Wave 3 is never smaller compared to waves 3 and 5.
- Wave 4 can be any type of correction pattern.
- Waves 2 and 4 are not overlapping.
- Wave 5 is an impulse wave or an ending wedge impulse wave.
- The price move of wave 5 is a minimum 70% of wave 4.
A wave 5 ending below the top of wave 3 is called a failing wave 5.
Structure
An impulse pattern is composed of 5 waves. The internal structure of these waves is: 5-3-5-3-5. The 5-waves are impulse waves, and the 3-waves are correction waves.
The Correct Count
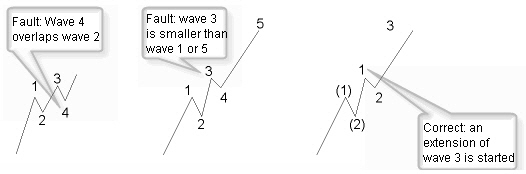
Figure 7.12: Impulse wave correct count.
Look at figure 7.12 for correct interpretation of wave counts.
Alternation within Impulse Waves
Sharp corrections are zigzags. Sideway corrections consist of flat corrections, triangles, double, and multiple corrections.
- If wave 2 is a sharp correction, wave 4 will be a sideway correction eight out of ten times.
- If wave 2 is a sideway correction, there is no alternation; wave 4 will be a sideway correction eight out of ten times.
- It is remarkable that wave 4 makes a sideway correction eight out of ten times.
- Extensions alternate by variation in length of the impulse wave. Wave 1 is short, wave 3 has an extension and is long, and wave 5 is short again.
- Extensions are most common in wave 3, but also in wave 5; this can be considered an alternation.
Price Targets and Fibonacci Levels
Many times, price targets are given by Fibonacci projections. Price retracement during a correction phase often will reach Fibonacci retracement levels.
Looking at wave 1 as an example, you will notice that, in most cases, it will retrace 23.6% up to 38.2% of the complete previous correction wave. Fifty percent retracement or more is rare for wave 1.
Extension of an Impulse Pattern
Waves 1, 3, 5, and A or C, if they are impulse waves, can be extended and therefore take much more time than the other waves.
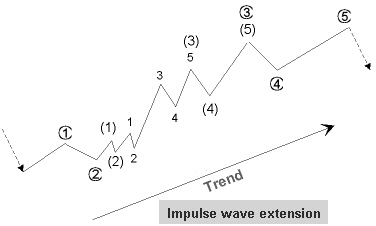
Figure 7.13: Wave extensions are very common in wave 3.
A wave extension is very common (figure 7.13); in most cases, this happens with wave 3.
Waves 1 and 5 incline toward equality.
In pattern definitions, we call a wave 1 extension “extension1.” This becomes extension3 for a wave 3 extension and extension 5 for a wave 5 extension.
A pattern with one extension has nine waves; a pattern with two extensions contains 13 waves; and a pattern with three extensions contains 17 waves.
The internal structure for 9 waves is 5-3-5-3-5-3-5-3-5. The 3 waves are correction waves.
Elliott Waves Next -Previous -Part 1 -Part 2 -Part 3 -Part 4 -Part 5 -Part 6 -Part 7
STOCATA Stocks Technical Analysis HOME
Links
Find a Stock ticker symbol, enter the ticker and find a chart, news, fundamentals and historical quotes.
Risk Disclosure: Futures and forex trading contains substantial risk and is not for every investor. An investor could potentially lose all or more than the initial investment. Risk capital is money that can be lost without jeopardizing ones’ financial security or life style. Only risk capital should be used for trading and only those with sufficient risk capital should consider trading. Past performance is not necessarily indicative of future results.
Hypothetical Performance Disclosure: Hypothetical performance results have many inherent limitations, some of which are described below. no representation is being made that any account will or is likely to achieve profits or losses similar to those shown; in fact, there are frequently sharp differences between hypothetical performance results and the actual results subsequently achieved by any particular trading program. One of the limitations of hypothetical performance results is that they are generally prepared with the benefit of hindsight. In addition, hypothetical trading does not involve financial risk, and no hypothetical trading record can completely account for the impact of financial risk of actual trading. for example, the ability to withstand losses or to adhere to a particular trading program in spite of trading losses are material points which can also adversely affect actual trading results. There are numerous other factors related to the markets in general or to the implementation of any specific trading program which cannot be fully accounted for in the preparation of hypothetical performance results and all which can adversely affect trading results.
See more 'Legal Disclosures' in the bottom menu bar!