
Latest News
2022 Start working on a new website
BBS Trading Expert
Watch the Youtube BBS video and here is a crude oil trading example
Want to know more about:
AXIOM business books awards, bronze medal! Thank You!
No longer available!
Favorite articles in 2010, 11, 12, 14 and 2015 S&C Readers' Choice Awards.

AXIOM Business Books Awards, bronze medal.

LOCKIT Complementing Trading Techniques
Trend reversal and trend continuation
Opening a position with a higher probability for making profit is possible if you trade after a trend reversal or after a trend continuation confirmation.
Trend reversal trading
First we will have a look at a trade after a trend reversal confirmation. Most important point of course is finding accurately a medium term price reversal point.
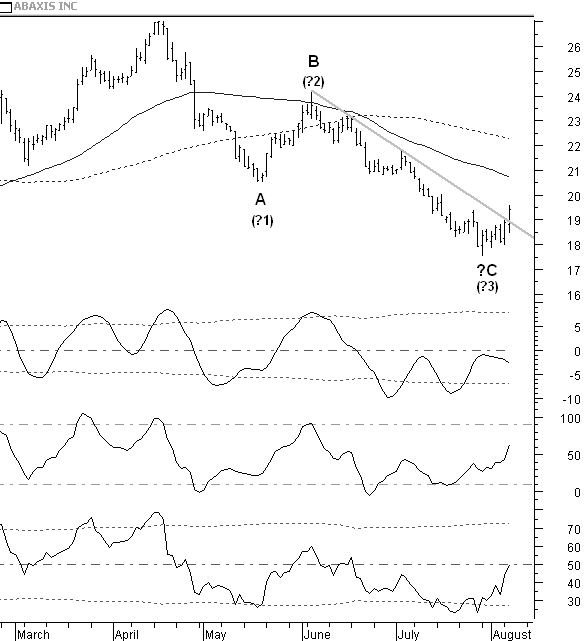
Figure 3.1: Abaxis daily, looking for medium term trend reversal; end of C wave reached?
August 7, 2007 price closes above the downtrend line. From the top in April, price has fallen back with an Elliot ABC zigzag correction. Wave A broke through the 50 and 100-days simple moving average (dashed line). Price reacted and formed wave B. There was some resistance from the 100-days moving average and price turned down bouncing against the resistance of the 50-days moving average.
Are we now reaching the end of correction wave C?
Should we open a long position here?
Arguments for buying:
The double bottom with divergence in the SVAPO(8,1), the first indicator in figure 2.1, is an indication for a medium term reversal. We have a double bottom with divergence in the second indicator SVE_BB%b_HA(18) moving up now. Finally in the last indicator, the RSI(14) we are moving out of the oversold area.
The closing price crossed above the downtrend line.
We may have a completed ABC Elliott correction wave.
Special offer: "Capturing Profit with technical Analysis"
Arguments against buying:
Strange is that the price move up of the last few days goes with a declining SVAPO. This would mean that the price up move is not confirmed with higher volume.
The 50 and 100-days moving average is near by and will present resistance very soon.
The risk/reward ratio is not good with a buying price now at $19.44 and support at the previous turning point at $17.54. This would be a stop at a rather high level of 11%.
After the correction wave we would be starting a new impulse wave 1. Impulse wave 1 is followed by correction wave 2, most of the time taking back a big part of wave 1.
Finally, we have no idea at all that wave C is completed and that we have reached the lowest point already. It is possible that we are still in the first correction wave (A) down, with an impulse wave 1 to 5. Then we would get wave 4 now and later on lower prices for wave 5.
LOCKIT Complementing Trading Techniques Next -Part 1 -Part 2
STOCATA Stocks Technical Analysis HOME
Links
Find a Stock ticker symbol, enter the ticker and find a chart, news, fundamentals and historical quotes.
Risk Disclosure: Futures and forex trading contains substantial risk and is not for every investor. An investor could potentially lose all or more than the initial investment. Risk capital is money that can be lost without jeopardizing ones’ financial security or life style. Only risk capital should be used for trading and only those with sufficient risk capital should consider trading. Past performance is not necessarily indicative of future results.
Hypothetical Performance Disclosure: Hypothetical performance results have many inherent limitations, some of which are described below. no representation is being made that any account will or is likely to achieve profits or losses similar to those shown; in fact, there are frequently sharp differences between hypothetical performance results and the actual results subsequently achieved by any particular trading program. One of the limitations of hypothetical performance results is that they are generally prepared with the benefit of hindsight. In addition, hypothetical trading does not involve financial risk, and no hypothetical trading record can completely account for the impact of financial risk of actual trading. for example, the ability to withstand losses or to adhere to a particular trading program in spite of trading losses are material points which can also adversely affect actual trading results. There are numerous other factors related to the markets in general or to the implementation of any specific trading program which cannot be fully accounted for in the preparation of hypothetical performance results and all which can adversely affect trading results.
See more 'Legal Disclosures' in the bottom menu bar!