
Latest News
2022 Start working on a new website
BBS Trading Expert
Watch the Youtube BBS video and here is a crude oil trading example
Want to know more about:
AXIOM business books awards, bronze medal! Thank You!
No longer available!
Favorite articles in 2010, 11, 12, 14 and 2015 S&C Readers' Choice Awards.

AXIOM Business Books Awards, bronze medal.

Technical Analysis Candlestick charts Part 5
Top Reversals
The following rules are applicable for a top reversal:
- A top reversal is only possible AFTER an uptrend.
- Most patterns need a confirmation.
- A confirmation must appear one up to three candles after the pattern.
- This confirmation is a big black candle, high volume with the new down move, a falling window, or breaking support.
- A reversal pattern during price reaction must be considered a continuation pattern.
- For best results, you must combine candlestick patterns with Western technical analysis.
- An unconfirmed pattern has no further meaning.
- Special offer: "Capturing Profit with technical Analysis"
Engulfing Bearish
|
In an uptrend, there is a small white body, not a doji, followed and enclosed by a bigger black body. |
|
Dark Cloud Cover
|
In an uptrend, a bigger white body is followed by a black body with a higher opening price than the high of the white body; however, the black candle closes below the midpoint of the white body. Confirmation is required. |
|
Bearish Counterattack
|
A bearish counterattack is a bigger white candle in an uptrend, followed by a bigger black candle. Closing prices of both candles are at the same price level. Confirmation is a must. |
|
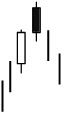
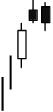
Bearish Harami
|
In an uptrend, a black (but preferably a white) body is followed by a small white or black candle that is completely covered by the first candle body. A top reversal signal after confirmation. White-black and white-white combinations are the most common. |
|

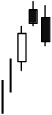
Bearish Harami Cross
|
In an uptrend, a black (but preferably a white) body is followed by a doji that is completely covered by the first candle body. A bearish harami cross pattern needs confirmation. |
|
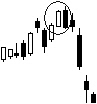
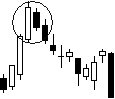
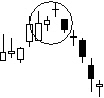
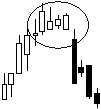
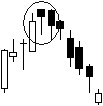
Evening Star
|
A bigger white body, followed by one or more small black or white bodies with a rising window above the closing price of the first white body. The black candle that follows ideally lays 50% or more within the first white body and has a falling window with the previous candle body. |
|

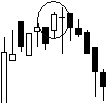
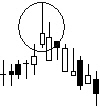
Evening Doji Star
|
A bigger white body, followed by one or more doji’s with a rising window above the closing price of the first white body. The black candle that follows ideally lays 50% or more within the first white body and has a falling window with the previous candle body. This is a stronger reversal pattern than the evening star. |
|
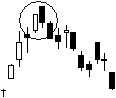
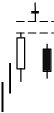
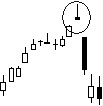
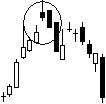
Bearish Abandoned Baby
|
An abandoned baby pattern is an evening doji star with a window between the doji and the white and black candle, resulting in an island reversal. The island can have more candles and more than one doji. |
|
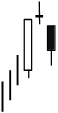
Hanging Man
|
A hanging man is a small white or black body close to the high price. It has a long shadow below, with a minimum size of twice the height of the body. There is a very small shadow or no shadow at the top. A dragonfly doji is a specific version of the hanging man pattern. Confirmation is required. |
|

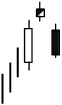
Bearish Shooting Star
|
A bearish shooting star is a small white (but preferably a small black) body near the low price. It has a long shadow above that is, at minimum, twice the size of the body. It has a very small shadow or no shadow below. There is a gap between the bodies of the bearish shooting star and the previous candle. |
|
Bearish Gravestone Doji
|
A bearish gravestone doji is a bearish shooting star where the opening, closing, and low prices are all about the same. It has a long shadow above and no shadow below. There is a gap between the bodies of the doji and the previous candle. |
|
Tweezer Tops
|
Two or more candles making highs together. Preferably, the highs are made with high prices, but they also can be combinations of any of the other prices. Size and color are not important. This is a reversal pattern that, most of the time, is part of another pattern. |
|

Three Black Crows
|
Three black candlesticks with each subsequent bar having lower closing prices, close to the low of the bar. Opening prices of candles two and three are within the body of the previous candles. Many times, there will be a small reaction before the new downtrend is resumed. |
|


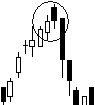
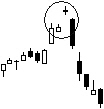
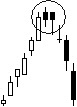
Bearish Dumpling Top
|
The bearish dumpling top is formed with a number of smaller candles. After this top formation pattern, the price usually makes a down-move with a falling window. A bearish dumpling top is a powerful reversal pattern. |
|
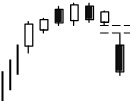
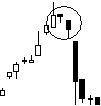
Upside Gap Two Crows
|
A white candle in an uptrend is followed by a smaller black candle with a gap above the closing price of the white candle. The body of the next black bar completely covers the previous black bar. This bar also has a gap with the closing price of the white candle. A very rare pattern. |
|
Two Crows
|
A white candle in an uptrend is followed by a smaller black candle with a gap above the closing price of the white candle. The body of the next black bar has an opening price within the body of the first black bar and a closing price within the body of the white candle. Confirmation is needed. |
|
Candlestick Charts Next -Previous -Part 1 -Part 2 -Part 3 -Part 4 -Part 5 -Part6 -Part7
STOCATA Stocks Technical Analysis HOME
Links
Find a Stock ticker symbol, enter the ticker and find a chart, news, fundamentals and historical quotes.
Risk Disclosure: Futures and forex trading contains substantial risk and is not for every investor. An investor could potentially lose all or more than the initial investment. Risk capital is money that can be lost without jeopardizing ones’ financial security or life style. Only risk capital should be used for trading and only those with sufficient risk capital should consider trading. Past performance is not necessarily indicative of future results.
Hypothetical Performance Disclosure: Hypothetical performance results have many inherent limitations, some of which are described below. no representation is being made that any account will or is likely to achieve profits or losses similar to those shown; in fact, there are frequently sharp differences between hypothetical performance results and the actual results subsequently achieved by any particular trading program. One of the limitations of hypothetical performance results is that they are generally prepared with the benefit of hindsight. In addition, hypothetical trading does not involve financial risk, and no hypothetical trading record can completely account for the impact of financial risk of actual trading. for example, the ability to withstand losses or to adhere to a particular trading program in spite of trading losses are material points which can also adversely affect actual trading results. There are numerous other factors related to the markets in general or to the implementation of any specific trading program which cannot be fully accounted for in the preparation of hypothetical performance results and all which can adversely affect trading results.
See more 'Legal Disclosures' in the bottom menu bar!