
Latest News
2022 Start working on a new website
BBS Trading Expert
Watch the Youtube BBS video and here is a crude oil trading example
Want to know more about:
AXIOM business books awards, bronze medal! Thank You!
No longer available!
Favorite articles in 2010, 11, 12, 14 and 2015 S&C Readers' Choice Awards.

AXIOM Business Books Awards, bronze medal.

Technical Analysis Candlestick charts Part 3
To Doji or Not?
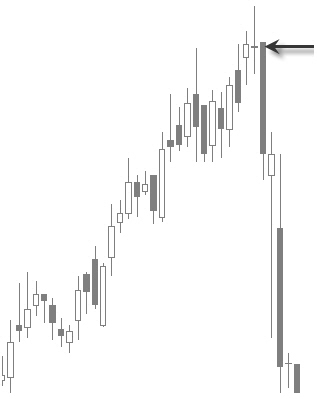
Figure 6.13: A doji after an up move and a closing below the previous closing is a strong indication for a price reversal.
Special offer: "Capturing Profit with technical Analysis"
A strong indication of a price reversal is a doji after a price move up and with a closing price below the previous closing price. (figure 6.13).
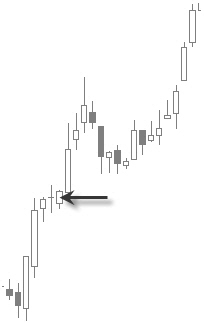
Figure 6.14: A doji after an up price move and a closing above the previous closing needs confirmation for a price reversal.
A doji after a price move up and with a closing price above the previous closing price needs confirmation for a price reversal. Figure 6.14 shows an example without confirmation; the price continues the uptrend.
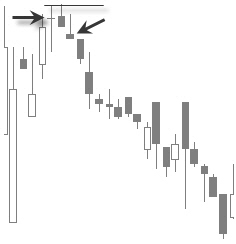
Figure 6.15: Example with confirmation resulting in a price reversal.
Figure 6.15 shows an example with confirmation resulting in a price reversal.
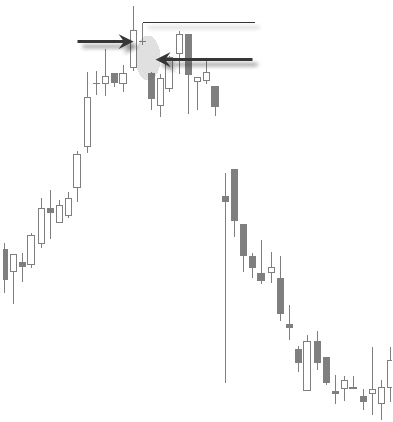
Figure 6.16: A doji or any other reversal pattern followed by a window is a reliable reversal signal.
A doji or any other candle reversal pattern followed by a candle with a window is a reliable reversal signal (figure 6.16).
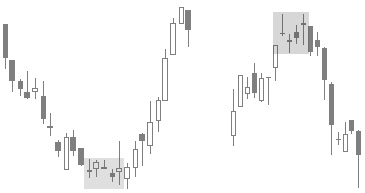
Figure 6.17: Extra pressure on the market with more doji’s appearing together
There is extra pressure on the market when more doji’s appear together (figure 6.17).
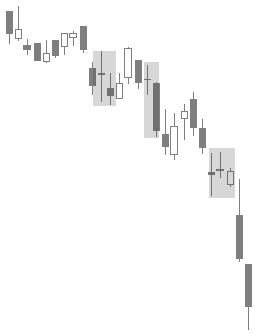
Figure 6.18: A doji within a downtrend has less value than a doji in an uptrend.
A doji within a downtrend (figure 6.18) has much less value than a doji in an uptrend.
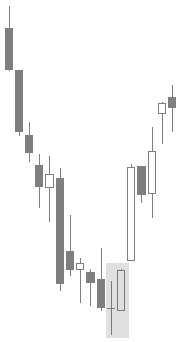
Figure 6.19: A doji in a downtrend always needs confirmation as a reversal signal.
A doji in a downtrend always needs confirmation for a reversal signal (figure 6.19).
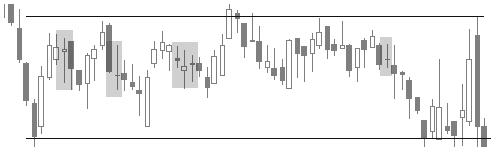
Figure 6.20: A doji within a flat neutral price zone has no meaning.
A doji within a flat, neutral price zone has no meaning (figure 6.20).
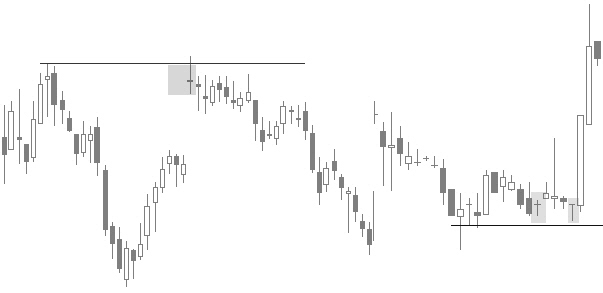
Figure 6.21: A doji or any other candle pattern confirms existing support or resistance.
A doji or any other candle pattern confirms existing support or resistance (figure 6.21).
Candlestick Charts Next -Previous -Part 1 -Part 2 -Part 3 -Part 4 -Part 5 -Part6 -Part7
STOCATA Stocks Technical Analysis HOME
Links
Find a Stock ticker symbol, enter the ticker and find a chart, news, fundamentals and historical quotes.
Risk Disclosure: Futures and forex trading contains substantial risk and is not for every investor. An investor could potentially lose all or more than the initial investment. Risk capital is money that can be lost without jeopardizing ones’ financial security or life style. Only risk capital should be used for trading and only those with sufficient risk capital should consider trading. Past performance is not necessarily indicative of future results.
Hypothetical Performance Disclosure: Hypothetical performance results have many inherent limitations, some of which are described below. no representation is being made that any account will or is likely to achieve profits or losses similar to those shown; in fact, there are frequently sharp differences between hypothetical performance results and the actual results subsequently achieved by any particular trading program. One of the limitations of hypothetical performance results is that they are generally prepared with the benefit of hindsight. In addition, hypothetical trading does not involve financial risk, and no hypothetical trading record can completely account for the impact of financial risk of actual trading. for example, the ability to withstand losses or to adhere to a particular trading program in spite of trading losses are material points which can also adversely affect actual trading results. There are numerous other factors related to the markets in general or to the implementation of any specific trading program which cannot be fully accounted for in the preparation of hypothetical performance results and all which can adversely affect trading results.
See more 'Legal Disclosures' in the bottom menu bar!