
Latest News
2022 Start working on a new website
BBS Trading Expert
Watch the Youtube BBS video and here is a crude oil trading example
Want to know more about:
AXIOM business books awards, bronze medal! Thank You!
No longer available!
Favorite articles in 2010, 11, 12, 14 and 2015 S&C Readers' Choice Awards.

AXIOM Business Books Awards, bronze medal.

Technical Analysis Price Patterns Part 3
Continuation Patterns
After a continuation pattern, the price continues the previous trend. Continuation patterns are a very good indication for entering a trade after a trend reaction.
Special offer: "Capturing Profit with technical Analysis"
Triangles
Triangle formations appear as symmetrical triangles, ascending triangles, and descending triangles. The triangle is a correction pattern for the previous price move. A triangle formation takes a minimum of 30 bars. Shorter-period triangle formations are classified as pennants.
Triangles in an Uptrend
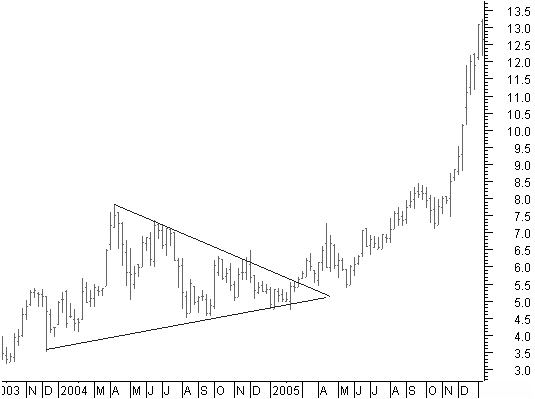
Figure 4.51: Symmetrical triangle pattern.
In the weekly price chart in figure 4.51, you can see higher bottoms and lower tops; this creates a symmetrical triangle. A breakout in the direction of the previous trend confirms the continuation pattern.
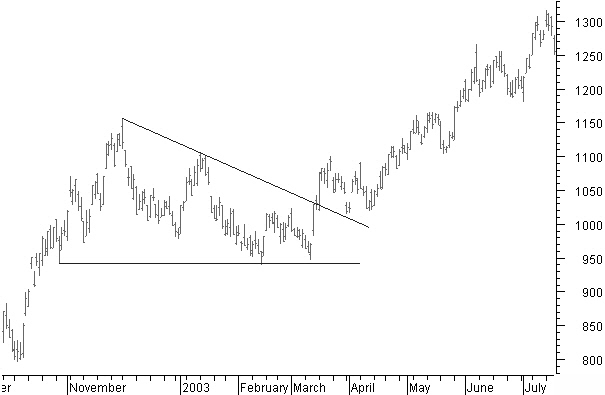
Figure 4.52: Descending triangle pattern.
In the daily chart in figure 4.52, lower tops are made in an uptrend. Next, the price drops back to horizontal support levels, and a descending triangle is created.
A breakout in the direction of the previous trend confirms the continuation pattern.
The Rectangle
The rectangle is a relatively rare pattern, appearing almost always as a continuation pattern, although it can exist as a reversal pattern. The price moves between two horizontal trendlines and touches a minimum of two times each line.
Rectangle in an Uptrend
Figure 4.54 shows a rectangle continuation pattern in an uptrend.
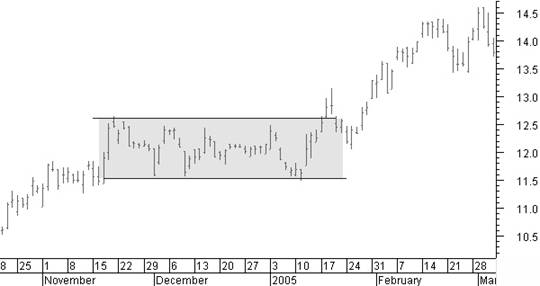
Figure 4.54: Rectangle continuation pattern in an uptrend.
Rectangle in a down trend
Figure 4.55 shows a rectangle continuation pattern in a downtrend.
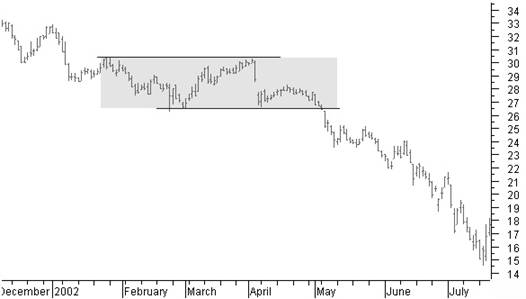
Figure 4.55: Rectangle continuation pattern in a downtrend.
Flags and Pennants
With a continuation of the previous trend 90% of the time, flags and pennants are reliable short term continuation patterns. They create a pause from 5 up to 25 bars in the current trend and then continue the previous trend. Most of the flags and pennants take up from 10 to 15 bars. Generally, the volume goes down during this phase.
Flags in an Uptrend
Figure 4.56 shows flags in an uptrend.
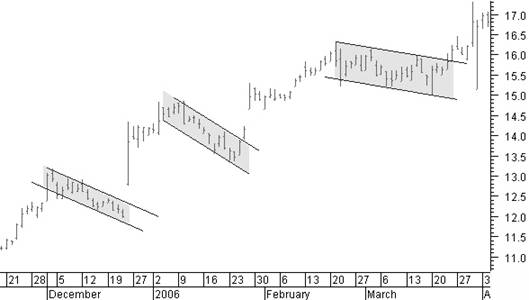
Figure 4.56: Flags in an uptrend.
Pennants in a Downtrend
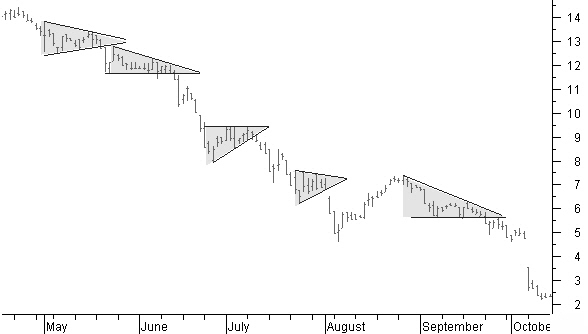
Figure 4.59: Pennants in a downtrend.
Look at pennants in a downtrend in figure 4.59.
Price Patterns NEXT -Previous -Part 1 -Part 2 -Part 3 -Part 4 -Part 5 -Part 6
STOCATA Stocks Technical Analysis HOME
Links
Find a Stock ticker symbol, enter the ticker and find a chart, news, fundamentals and historical quotes.
Risk Disclosure: Futures and forex trading contains substantial risk and is not for every investor. An investor could potentially lose all or more than the initial investment. Risk capital is money that can be lost without jeopardizing ones’ financial security or life style. Only risk capital should be used for trading and only those with sufficient risk capital should consider trading. Past performance is not necessarily indicative of future results.
Hypothetical Performance Disclosure: Hypothetical performance results have many inherent limitations, some of which are described below. no representation is being made that any account will or is likely to achieve profits or losses similar to those shown; in fact, there are frequently sharp differences between hypothetical performance results and the actual results subsequently achieved by any particular trading program. One of the limitations of hypothetical performance results is that they are generally prepared with the benefit of hindsight. In addition, hypothetical trading does not involve financial risk, and no hypothetical trading record can completely account for the impact of financial risk of actual trading. for example, the ability to withstand losses or to adhere to a particular trading program in spite of trading losses are material points which can also adversely affect actual trading results. There are numerous other factors related to the markets in general or to the implementation of any specific trading program which cannot be fully accounted for in the preparation of hypothetical performance results and all which can adversely affect trading results.
See more 'Legal Disclosures' in the bottom menu bar!