
Latest News
2022 Start working on a new website
BBS Trading Expert
Watch the Youtube BBS video and here is a crude oil trading example
Want to know more about:
AXIOM business books awards, bronze medal! Thank You!
No longer available!
Favorite articles in 2010, 11, 12, 14 and 2015 S&C Readers' Choice Awards.

AXIOM Business Books Awards, bronze medal.

MetaStock Formulas
HOME Back to MetaStock Formulas Overview
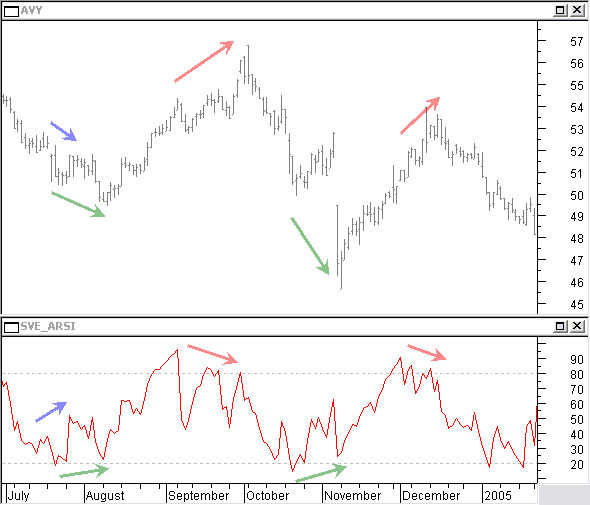
SVE_ARSI
The Relative Strength Index (RSI) was developed by J. Welles Wilder and published in Commodities magazine in June 1978 and in his “New Concepts in Technical Trading Systems” the same year.
The RSI is a momentum indicator measuring the speed at which a security's price is changing. Early signaling for entry and exit points is the main advantage of this leading indicator.
One of the most valuable ways utilizing the RSI is to watch for divergences with price. A divergence describes a situation when the trend of the oscillator moves in a different direction from the prevailing price trend.
Looking for a way to have as much as possible reliable divergence signals, I was thinking of using a smaller average in the creation of the RSI oscillator. The original RSI uses the same RSI averaging period both for the up closing and down closing bars. However, to me, more logical would be using the number of up bars for averaging the up closing and the number of down bars for averaging the down closing bars in the selected RSI period. So, I am using a dynamically changing average to get more reliable divergences compared to the standard RSI.
This is the formula:
SVE_ARSI:
Period:=Input("ARSI Time Period ->",1,100,14);
UpCount:=Sum(If(ROC(C,1,$)>=0,1,0),Period);
DnCount:=Period-UpCount;
UpMove:=ExtFml("Forum.MOV",If(ROC(C,1,$)>=0,ROC(C,1,$),0),UpCount*2-1,E);
DnMove:=ExtFml("Forum.MOV",If(ROC(C,1,$)<0,Abs(ROC(C,1,$)),0),DnCount*2-1,E);
RS:=UpMove/(DnMove+0.0001);
arsi:=100-(100/(1+RS));
arsi
To be able to use this formula, you need the external "forum.dll" file that has a function for a dynamic moving average. You can find this file on the Equis forum http://forum.equis.com/. Please make sure reading the CopyRight notice.
Special offer: "Capturing Profit with technical Analysis"
The most valuable way utilizing ARSI is to watch for divergences with price. A divergence describes a situation when the trend of the oscillator moves in a different direction from the prevailing price trend.
When the oscillator creates a higher bottom while the price makes a lower bottom, they diverge. This is mostly found at the end of a downtrend, indicating an uptrend reversal.
When the oscillator creates a lower top while the price makes a higher top, they diverge. This is mostly found at the end of an uptrend, indicating a downtrend reversal. These divergences are commonly known as normal divergences.
When the oscillator makes a lower bottom while price sets a higher bottom, they diverge. This is mostly found in a price uptrend after a temporary price correction, indicating a continuation of the previous uptrend.
When the oscillator has a higher top while price sets a lower top, they diverge. This is mostly found in a price downtrend after a temporary price up correction, indicating a continuation of the previous downtrend. We call these last two reverse or hidden divergences.
Search the Internet
HOME Back to MetaStock Formulas Overview
Links
Find a Stock ticker symbol, enter the ticker and find a chart, news, fundamentals and historical quotes.
Risk Disclosure: Futures and forex trading contains substantial risk and is not for every investor. An investor could potentially lose all or more than the initial investment. Risk capital is money that can be lost without jeopardizing ones’ financial security or life style. Only risk capital should be used for trading and only those with sufficient risk capital should consider trading. Past performance is not necessarily indicative of future results.
Hypothetical Performance Disclosure: Hypothetical performance results have many inherent limitations, some of which are described below. no representation is being made that any account will or is likely to achieve profits or losses similar to those shown; in fact, there are frequently sharp differences between hypothetical performance results and the actual results subsequently achieved by any particular trading program. One of the limitations of hypothetical performance results is that they are generally prepared with the benefit of hindsight. In addition, hypothetical trading does not involve financial risk, and no hypothetical trading record can completely account for the impact of financial risk of actual trading. for example, the ability to withstand losses or to adhere to a particular trading program in spite of trading losses are material points which can also adversely affect actual trading results. There are numerous other factors related to the markets in general or to the implementation of any specific trading program which cannot be fully accounted for in the preparation of hypothetical performance results and all which can adversely affect trading results.
See more 'Legal Disclosures' in the bottom menu bar!