
Latest News
2022 Start working on a new website
BBS Trading Expert
Watch the Youtube BBS video and here is a crude oil trading example
Want to know more about:
AXIOM business books awards, bronze medal! Thank You!
No longer available!
Favorite articles in 2010, 11, 12, 14 and 2015 S&C Readers' Choice Awards.

AXIOM Business Books Awards, bronze medal.

MetaStock Formulas
HOME Back to MetaStock Formulas Overview
Smoothed Bollinger %b indicator (SVE_BB%b)
Bollinger Bands are from John Bollinger and are mentioned in his book “Bollinger on Bollinger Bands” (Bollinger, 2001).
The Bollinger Bands in the following figure consist of a set of three curves drawn in relation to price data. The middle band is usually a simple 20-bars moving average, which serves as the base for the upper and lower bands.
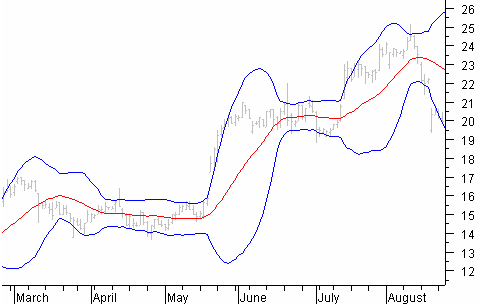
Upper Band = Middle Band + 2 * 20-period closing prices standard deviation
Lower Band = Middle Band - 2 * 20-period closing prices standard deviation
The use of the standard deviation moving average is a method to measure price volatility. With trending prices, the bands will be wider as a result of the higher volatility in price, moving farther away from the mean, whereas during consolidation periods, bands will be narrower as a result of smaller price moves closer to the mean. This changing bandwidth is used for volatility-based trading opportunities.
%b is a measure of where price is in relation to the outer Bollinger bands and therefore strongly related to volatility. %b is created as an oscillator to show overbought and oversold situations when price is moving close or beyond the upper or lower Bollinger bands.
This is the basic %b formula:
%b = (close – lower band) / (Upper band – lower band)
For the basic %b formula, we multiply the %b result with 100 to get an oscillator moving between 0 and 100 (with overshoots):
{The upper band}
upper:=2*Stdev( CLOSE,20 ) + Mov(CLOSE,20,SIMPLE);
{The lower band}
lower:=Mov(CLOSE,20,SIMPLE)-2*Stdev( CLOSE,20);
{%b}
percb:=(C-lower)/(upper-lower)*100;
percb
Applying some math we can simplify the formula with the following result for the basic (MetaStock) formula for a Bollinger Bands %b indicator using closing prices and a simple moving average:
{BB%b_C_S}
percb:=(C+2*Stdev(C,20)-Mov(C,20,S))/(4*Stdev(C,20))*100;
percb
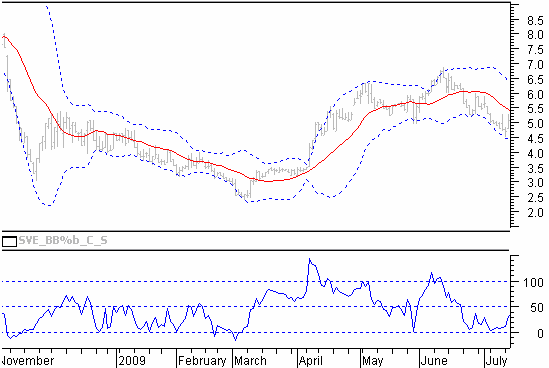
As you can see in the above indicator it is leading most of the time, showing high levels, low levels, and eventually divergences prior to turning points in price. Unfortunately it is a very choppy oscillator. Finding the more important turning points and trying to trade with the %b indicator day by day is not an easy task.
Special offer: "Capturing Profit with technical Analysis"
Using a heikin ashi re-calculated closing price, a TEMA average and the zero-lagging technique, we can create this indicator with more clear turning points.
This is the modified SVE_BB%b formula:
{Sylvain Vervoort SVE_BB%b}
period:=Input("%b period: ",1,100,18);
TeAv:=Input("Tema average: ",1,30,8);
afwh:= Input("Standard deviation high ",.1,5,1.6);
afwl:= Input("Standard deviation Low ",.1,5,1.6);
afwper:= Input("Standard deviation period ",1,200,63);
haOpen:=(Ref((O+H+L+C)/4,-1) + PREV)/2;
haC:=((O+H+L+C)/4+haOpen+Max(H,haOpen)+Min(L,haOpen))/4;
TMA1:= Tema(haC,TeAv);
TMA2:= Tema(TMA1,TeAv);
Diff:= TMA1 - TMA2;
ZlHA:= TMA1 + Diff;
percb:=(Tema(ZLHA,TeAv)+2*Stdev(Tema(ZLHA,TeAv),period)- Mov(Tema(ZLHA,TeAv),period,WEIGHTED))/(4*Stdev(Tema(ZLHA,TeAv),period))*100;
percb;
50+afwh*Stdev(percb,afwper);
50-afwl*Stdev(percb,afwper);
50
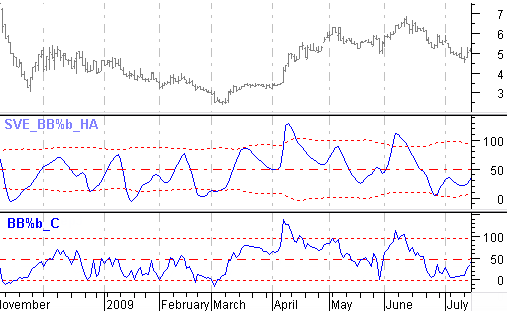
Compare in the following figure the original BB%b with the smoothed version SVE_BB%b.
We will split this chart in two parts. The first part ends March 9, 2009. In November there was a big price drop and some recuperation. Next price is moving further downwards. What does the SVE_BB%b indicator tell you in that period?
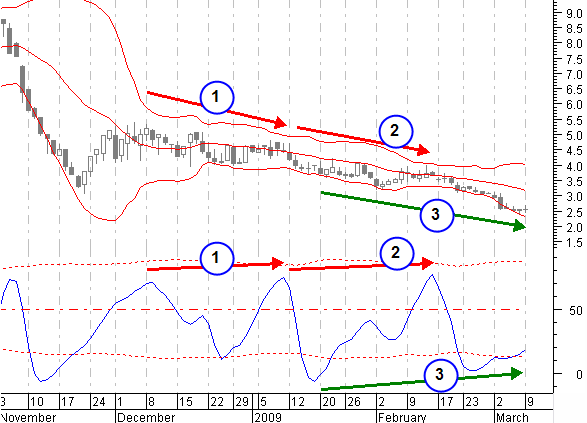
In the above figure you can see at the start a big price drop and a first reaction until the beginning of December in a convergent move with lower tops in price and the indicator. Price now continues the down move in a phase (1) and is making a lower top in price, but a higher top in the indicator beginning of January 2009. This is an inverse or hidden divergence pointing in the direction of a continuation of the previous downtrend. And once more, price continues the down move until half of February when you can see again the same situation with phase (2), with lower tops in price and higher tops in the indicator. Another hidden divergence telling you that price will continue the down move. Price is making lower bottoms, but now you can see higher bottoms with phase (3) in the indicator. This is a normal divergence telling you that you should expect a price up move now. Note that price is bottoming with doji’s in the candlestick chart and price has been moving within narrow Bollinger bands indicating low volatility for more than 3 months already. Clearly you can open a position here with a very good risk-to-reward ratio, with a buy at $2.53 and an initial closing price stop at $2.38. An ideal entry for opening a long position with a risk of only 6%.
Let’s continue with the next figure, the second part of the original chart. Phase (3) actually brought a trend reversal and started a new price up move. There is a nice convergent up move until the beginning of may with phase (4), showing a negative divergence with a higher top in price but a lower top in the indicator. This points in the direction of a price reversal.
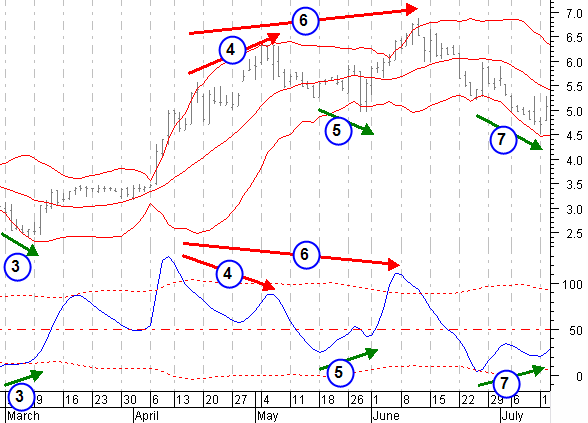
Time to take the more than 100% profit! What follows is a correction back to the lower Bollinger band. The end of this correction is showing with phase (5) a positive divergence with lower bottoms in price and higher bottoms in the indicator. This is pushing price up again. You could go for a new long position here. The tops in price and indicator beginning of June, end phase (6) with a negative divergence, pushing price down for a bigger correction. It now looks like the end of this correction is reached with a new positive divergence in phase (7).
Search the Internet
HOME Back to MetaStock Formulas Overview
Links
Find a Stock ticker symbol, enter the ticker and find a chart, news, fundamentals and historical quotes.
Risk Disclosure: Futures and forex trading contains substantial risk and is not for every investor. An investor could potentially lose all or more than the initial investment. Risk capital is money that can be lost without jeopardizing ones’ financial security or life style. Only risk capital should be used for trading and only those with sufficient risk capital should consider trading. Past performance is not necessarily indicative of future results.
Hypothetical Performance Disclosure: Hypothetical performance results have many inherent limitations, some of which are described below. no representation is being made that any account will or is likely to achieve profits or losses similar to those shown; in fact, there are frequently sharp differences between hypothetical performance results and the actual results subsequently achieved by any particular trading program. One of the limitations of hypothetical performance results is that they are generally prepared with the benefit of hindsight. In addition, hypothetical trading does not involve financial risk, and no hypothetical trading record can completely account for the impact of financial risk of actual trading. for example, the ability to withstand losses or to adhere to a particular trading program in spite of trading losses are material points which can also adversely affect actual trading results. There are numerous other factors related to the markets in general or to the implementation of any specific trading program which cannot be fully accounted for in the preparation of hypothetical performance results and all which can adversely affect trading results.
See more 'Legal Disclosures' in the bottom menu bar!