
Latest News
2022 Start working on a new website
BBS Trading Expert
Watch the Youtube BBS video and here is a crude oil trading example
Want to know more about:
AXIOM business books awards, bronze medal! Thank You!
No longer available!
Favorite articles in 2010, 11, 12, 14 and 2015 S&C Readers' Choice Awards.

AXIOM Business Books Awards, bronze medal.

MetaTrader Formulas
HOME Back to MetaTrader Formulas Overview
Heikin Ashi average closing price: SVE_haC
Heikin ashi, Japanese for “average bar”, is a technique using a special kind of candle stick bars for better visualizing price trends. This technique has been introduced by Dan Valcu in the February 2004 issue of Stocks & Commodities magazine.
The original calculation of the heikin ashi candle stick is as follows:
xClose = (Open+High+Low+Close)/4; or the average price of the current bar
xOpen = [xOpen(Previous Bar) + Close(Previous Bar)]/2; or the midpoint of the previous bar
xHigh = Max(High, xOpen, xClose); the highest value in the set
xLow = Min(Low, xOpen, xClose); the lowest value in the set
However, since the xClose component is always less than or equal to the High component, it is redundant within the MAX function of xHigh and a modified xHigh can be defined as:
modified xHigh = Max(High, xOpen);
The same reasoning is valid for the xLow function:
modified xLow = Min(Low, xOpen);
Next I calculate the average heikin ashi closing price as the result of:
(xClose+xOpen+xHigh+xLow)/4.
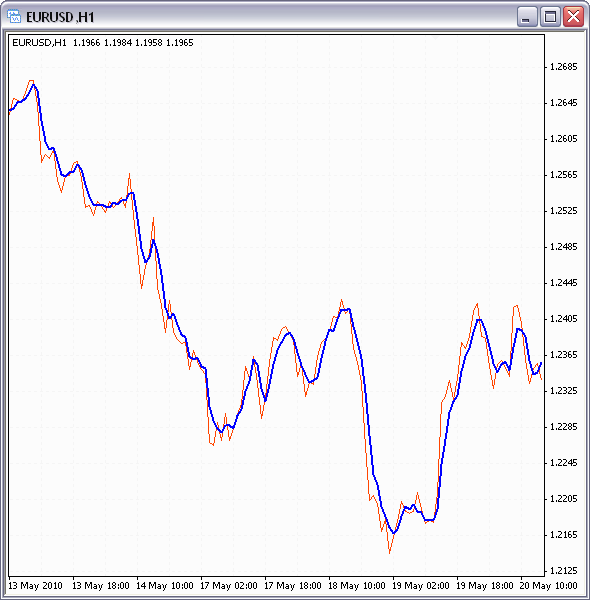
We will mainly use this re-calculated closing price as a smoothed closing price introducing almost no delay. In the hourly chart below, you can see in red the normal closing prices and in blue the re-calculated average heikin ashi closing prices.
Special offer: "Capturing Profit with technical Analysis"
For MetaTrader4 you can use the following custom formula (SVE_haC):
| //+------------------------------------------------------------------+ //| SVE_haC.mq4 | //| Copyright c 2010, Sylvain Vervoort | //| http://stocata.org/ | //+------------------------------------------------------------------+ //| calculation of the average heikin ashi closing price | //| (haO+haH+haL+haC)/4 | //| based on the heikin ashi re-calculated prices | //| Index buffer 3 holds the haOpen value | //+------------------------------------------------------------------+ #property copyright "Copyright © 2010, Sylvain Vervoort" #property link "http://stocata.org/" #property indicator_chart_window #property indicator_buffers 5 #property indicator_color1 Blue #property indicator_width1 1 //---- extern color color1 = Red; //---- buffers double haBuffer1[]; double haBuffer2[]; double haBuffer3[]; double haBuffer4[]; double haBuffer5[]; //---- int ExtCountedBars=0; //+------------------------------------------------------------------+ //| Custom indicator initialization function | //|------------------------------------------------------------------+ int init() { //---- indicators IndicatorBuffers(5); SetIndexStyle(0,DRAW_LINE); SetIndexBuffer(0,haBuffer5); SetIndexBuffer(1,haBuffer1); SetIndexStyle(1,DRAW_NONE); SetIndexBuffer(2,haBuffer2); SetIndexStyle(2,DRAW_NONE); SetIndexBuffer(3,haBuffer3); SetIndexStyle(3,DRAW_NONE); SetIndexBuffer(4,haBuffer4); SetIndexStyle(4,DRAW_NONE); IndicatorShortName("SVE_haC"); return(0); } //+------------------------------------------------------------------+ //| Custom indicator iteration function | //+------------------------------------------------------------------+ int start() { double haOpen, haHigh, haLow, haClose, AvCl; if(Bars<=10) return(0); ExtCountedBars=IndicatorCounted(); //---- check for possible errors if (ExtCountedBars<0) return(-1); //---- last counted bar will be recounted if (ExtCountedBars>0) ExtCountedBars--; int pos=Bars-ExtCountedBars-1; while(pos>=0) { haOpen=(haBuffer3[pos+1]+haBuffer4[pos+1])/2; haClose=(Open[pos]+High[pos]+Low[pos]+Close[pos])/4; haHigh=MathMax(High[pos], MathMax(haOpen, haClose)); haLow=MathMin(Low[pos], MathMin(haOpen, haClose)); AvCl=(haOpen+haClose+haHigh+haLow)/4; if (haOpen<haClose) { haBuffer1[pos]=haLow; haBuffer2[pos]=haHigh; } else { haBuffer1[pos]=haHigh; haBuffer2[pos]=haLow; } haBuffer3[pos]=haOpen; haBuffer4[pos]=haClose; haBuffer5[pos]=AvCl; pos--; } return(0); } //+------------------------------------------------------------------+ |
If you create this indicator in MetaTrader, make sure you give it the name "SVE_haC", because we will call this function by this name from other indicators that we will present further on.
Search the Internet
HOME Back to MetaTrader Formulas Overview
Links
Find a Stock ticker symbol, enter the ticker and find a chart, news, fundamentals and historical quotes.
Risk Disclosure: Futures and forex trading contains substantial risk and is not for every investor. An investor could potentially lose all or more than the initial investment. Risk capital is money that can be lost without jeopardizing ones’ financial security or life style. Only risk capital should be used for trading and only those with sufficient risk capital should consider trading. Past performance is not necessarily indicative of future results.
Hypothetical Performance Disclosure: Hypothetical performance results have many inherent limitations, some of which are described below. no representation is being made that any account will or is likely to achieve profits or losses similar to those shown; in fact, there are frequently sharp differences between hypothetical performance results and the actual results subsequently achieved by any particular trading program. One of the limitations of hypothetical performance results is that they are generally prepared with the benefit of hindsight. In addition, hypothetical trading does not involve financial risk, and no hypothetical trading record can completely account for the impact of financial risk of actual trading. for example, the ability to withstand losses or to adhere to a particular trading program in spite of trading losses are material points which can also adversely affect actual trading results. There are numerous other factors related to the markets in general or to the implementation of any specific trading program which cannot be fully accounted for in the preparation of hypothetical performance results and all which can adversely affect trading results.
See more 'Legal Disclosures' in the bottom menu bar!