
Latest News
2022 Start working on a new website
BBS Trading Expert
Watch the Youtube BBS video and here is a crude oil trading example
Want to know more about:
AXIOM business books awards, bronze medal! Thank You!
No longer available!
Favorite articles in 2010, 11, 12, 14 and 2015 S&C Readers' Choice Awards.

AXIOM Business Books Awards, bronze medal.

NinjaTrader Formulas
HOME Back to Ninjatrader Formulas Overview
IRSTS - An Expert Of A System
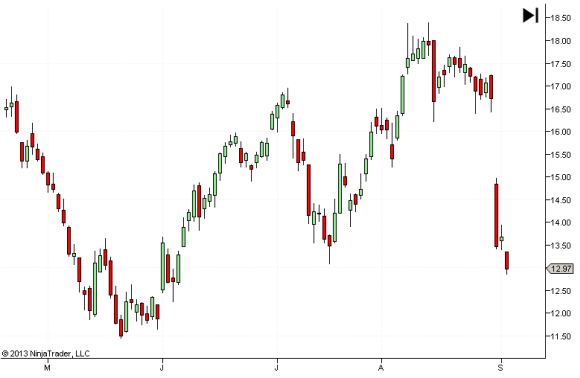
When in doubt, follow the expert — except that this expert is a trading system that will make your buy & sell decisions easier. Keep in mind there is no perfect expert that will make profitable trades all the time. Your best chance for a profit at the end of the day is to stay in a profitable trade for as long as possible and avoid entering losing trades. Together with good risk & money management, the odds will be in your favor. An expert system that color-codes your candlestick chart will give you the best possible indication of when to buy and when to sell. In the standard candle chart in the figure below, a green candle body indicates that the day closed with a price higher than the opening price; a red candle body means the closing price was below the opening price. On this chart, it's not so easy to see where to take action.
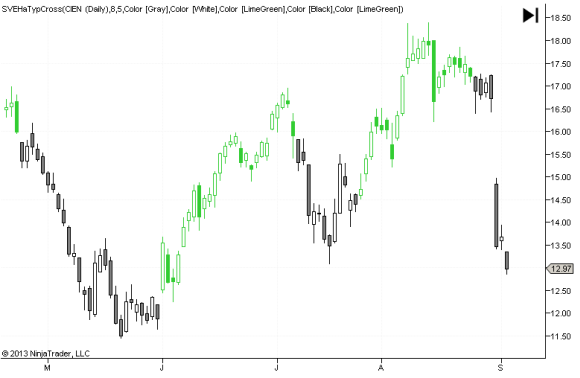
Now look at the following figure. It's the same chart but color-coded by an expert color-coding system. With this chart, if you buy when the candle color changes to green and sell or go short when it changes to black, it's fairly clear where you will buy and sell. Besides having clearer indications for long or short positions, you also have the advantage of the candlestick chart format itself. Aa white or unfilled candle body means the day closed with a closing price above the opening price. A filled body, either green or black, means the day closed below the opening price of the day. This chart shows a nice, profitable example, but it will not always be that way!
Creating the Expert
First, you need a rule that tells you when to go long and when to go short. This could be an extremely complicated setup with several rules, or it could be a simple approach such as a trend-following system using moving averages and a crossover between two averages. A crossover rule will work well as long as prices are trending. Unfortunately, as we know all too well, this is often not the case. The moving averages will cross and result in losses.
Special offer: "Capturing Profit with technical Analysis"
Hence, it becomes necessary to apply techniques to avoid these unprofitable crosses as much as possible. And even then, with every signal you will have to decide whether to take the trade based on other technical analysis techniques. To limit the volatility of the price change, I will not use closing prices to create the expert indicator ("SVEHaTypCross"). I will use a smoothed version of closing prices based on heikin-ashi calculations on one side, and on the other side I will use the typical closing price that is calculated by adding the high, low, and closing price and dividing the sum by three.
A full description can be found in the Stocks & Commodities October 2013 publication. You can download the NinjaScript expert ZIP file below.
Special offer: "BBS Band Indicators" DVD
Download the NinjaScript formulas for this expert system: SVEHaTypCross.zip
HOME Back to NinjaTrader Formulas Overview
Links
Find a Stock ticker symbol, enter the ticker and find a chart, news, fundamentals and historical quotes.
Risk Disclosure: Futures and forex trading contains substantial risk and is not for every investor. An investor could potentially lose all or more than the initial investment. Risk capital is money that can be lost without jeopardizing ones’ financial security or life style. Only risk capital should be used for trading and only those with sufficient risk capital should consider trading. Past performance is not necessarily indicative of future results.
Hypothetical Performance Disclosure: Hypothetical performance results have many inherent limitations, some of which are described below. no representation is being made that any account will or is likely to achieve profits or losses similar to those shown; in fact, there are frequently sharp differences between hypothetical performance results and the actual results subsequently achieved by any particular trading program. One of the limitations of hypothetical performance results is that they are generally prepared with the benefit of hindsight. In addition, hypothetical trading does not involve financial risk, and no hypothetical trading record can completely account for the impact of financial risk of actual trading. for example, the ability to withstand losses or to adhere to a particular trading program in spite of trading losses are material points which can also adversely affect actual trading results. There are numerous other factors related to the markets in general or to the implementation of any specific trading program which cannot be fully accounted for in the preparation of hypothetical performance results and all which can adversely affect trading results.
See more 'Legal Disclosures' in the bottom menu bar!