
Latest News
2022 Start working on a new website
BBS Trading Expert
Watch the Youtube BBS video and here is a crude oil trading example
Want to know more about:
AXIOM business books awards, bronze medal! Thank You!
No longer available!
Favorite articles in 2010, 11, 12, 14 and 2015 S&C Readers' Choice Awards.

AXIOM Business Books Awards, bronze medal.

Band Break System BBS
BBS Chart Template part 2
BBS - Intro - Results - Template - Basic - More_money - Selecting_stocks
We will now add a couple of extra indicators that will help you to make decisions to override the BBS signal.
First we add the S10_RSI_Xtreme indicator in a separate window. This is a fast short term indicator. Short term reversals are nicely indicated with extreme high (100) or low (0) values. It can be used to find entry points in an ongoing medium to longer term trend. Or it can be used as an early exit signal after a medium term trend move.
Keep in mind that the start of medium term reversals will always be started from an extreme low (or high for a short position) of this indicator.
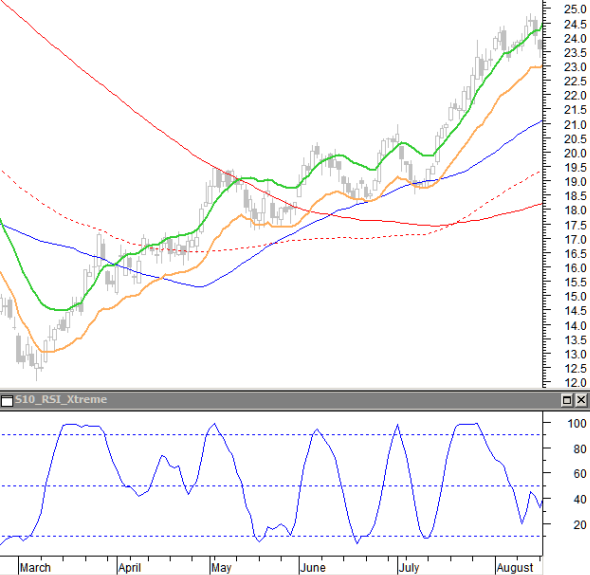
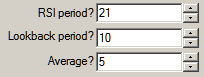
The S10_RSI_Xtreme indicator uses 3 parameters. The RSI period, a look back period and a summing average. The defaults used are respectively: 21, 10 and 5.
Now we add another sub window with a standard stochastic oscillator (blue curve) for the medium term with the default time periods equaling 30 and a 5 period slowing.
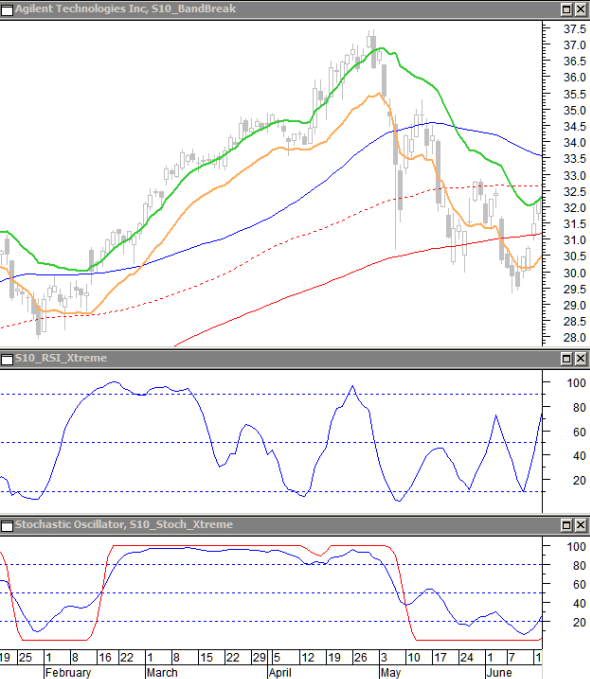
And finally we add in the same sub window the S10_Stoch_Xtreme indicator (red curve).
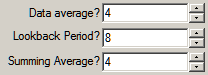
The S10_Stoch_Xtreme indicator uses 3 parameters. A data average, a look back period and a summing average. The defaults used are respectively: 4, 8 and 4.
The 30 time periods standard stochastic with a 5 periods slowing is a slow stochastic. This allows you more easily finding the turning points for the medium term moves when moving up from the 0 to the 100 level and the other way around.
The S10_Stoch_Xtreme indicator gives you an extreme clear vision of the medium term reversal points. Good to know is that automatic trading based on this indicator only is profitable. In BBS you can use it as an ultimate warning to get out of a trade.
BBS Chart Template PREVIOUS -Next BBS Basic Trading
STOCATA Stocks Technical Analysis HOME
Links
Find a Stock ticker symbol, enter the ticker and find a chart, news, fundamentals and historical quotes.
Risk Disclosure: Futures and forex trading contains substantial risk and is not for every investor. An investor could potentially lose all or more than the initial investment. Risk capital is money that can be lost without jeopardizing ones’ financial security or life style. Only risk capital should be used for trading and only those with sufficient risk capital should consider trading. Past performance is not necessarily indicative of future results.
Hypothetical Performance Disclosure: Hypothetical performance results have many inherent limitations, some of which are described below. no representation is being made that any account will or is likely to achieve profits or losses similar to those shown; in fact, there are frequently sharp differences between hypothetical performance results and the actual results subsequently achieved by any particular trading program. One of the limitations of hypothetical performance results is that they are generally prepared with the benefit of hindsight. In addition, hypothetical trading does not involve financial risk, and no hypothetical trading record can completely account for the impact of financial risk of actual trading. for example, the ability to withstand losses or to adhere to a particular trading program in spite of trading losses are material points which can also adversely affect actual trading results. There are numerous other factors related to the markets in general or to the implementation of any specific trading program which cannot be fully accounted for in the preparation of hypothetical performance results and all which can adversely affect trading results.
See more 'Legal Disclosures' in the bottom menu bar!