
Latest News
2022 Start working on a new website
BBS Trading Expert
Watch the Youtube BBS video and here is a crude oil trading example
Want to know more about:
AXIOM business books awards, bronze medal! Thank You!
No longer available!
Favorite articles in 2010, 11, 12, 14 and 2015 S&C Readers' Choice Awards.

AXIOM Business Books Awards, bronze medal.

LOCKIT Application Example Part 2
The indicators on the weekly chart
Let’s see if our indicators are confirming the end of wave 4 on the weekly chart.
To get this confirmation we use 3 indicators:
The SVAPO oscillator with standard settings.
The RSI indicator with a 14 weeks SVE_RSI_StDev, and deviations at 1.5 over a period of 100 days.
The Bollinger %b oscillator SVE_BB%b_HA, over a period of 18 weeks with reference levels at 10 and 90.
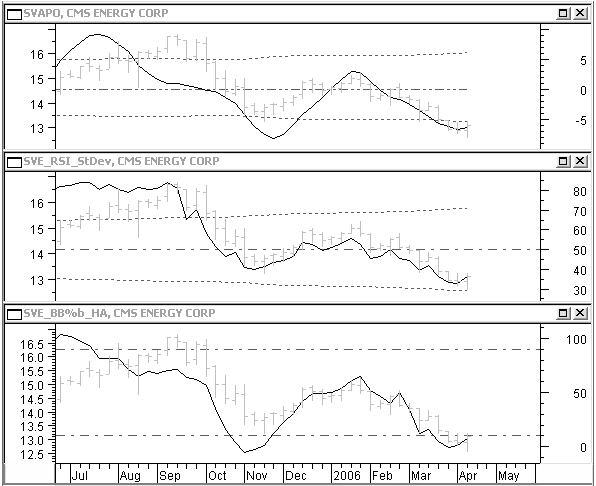
Figure 2.5: CMS weekly indicators.
Note how in figure 2.5 SVAPO is turning from below the lower standard deviation, the oversold area and is making a divergence with price, lower bottoms in price with higher bottoms in SVAPO.
The RSI is turning up from below, close to the 30-level.
The Bollinger %b oscillator turns up from below the 10-level and diverges with price.
So, it seems that also the indicators are showing the start of a medium term up move.
Daily chart
In the daily chart we can analyze in more detail the development of wave 4 up to now. In a correction wave, waves A and C are basically impulse waves and wave B is a correction wave.
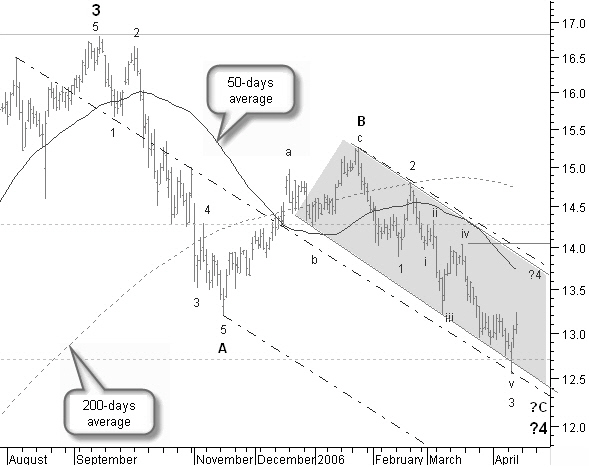
Figure 2.6: CMS daily chart, detail of wave 4.
Special offer: "Capturing Profit with technical Analysis"
An impulse wave of the same order generally moves within the same trend channel. Figure 2.6 shows us that this is clearly the case. Looking at the wave count it seems that we are having now sub wave 4 within wave C. In other words we are still expecting impulse wave 5 down, which should bring the price below $12.55.
Wave C is not only moving within the same channel, but also within the upper side of a downward pitchfork with exact the same slope. We expect the up move of wave 4 to find resistance at the upper side of this pitchfork, against the 50-days simple moving average and close to a resistance at $14.0. This seems to be a good scenario to end wave 4 and to start wave 5 down.
The weekly chart shows a possible start of a medium term up move. But, buying now would not give a good risk/reward ratio. If however we are wrong about not buying now, we can still buy when price breaks the resistance just mentioned. We will follow-up the further price evolution on the daily chart. We expect a short term up move, followed by a continuation of the downtrend to make a new low.
LOCKIT Stock Trading Example Next -Previous -Part 1 -Part 2 -Part 3 -Part 4
Links
Find a Stock ticker symbol, enter the ticker and find a chart, news, fundamentals and historical quotes.
Risk Disclosure: Futures and forex trading contains substantial risk and is not for every investor. An investor could potentially lose all or more than the initial investment. Risk capital is money that can be lost without jeopardizing ones’ financial security or life style. Only risk capital should be used for trading and only those with sufficient risk capital should consider trading. Past performance is not necessarily indicative of future results.
Hypothetical Performance Disclosure: Hypothetical performance results have many inherent limitations, some of which are described below. no representation is being made that any account will or is likely to achieve profits or losses similar to those shown; in fact, there are frequently sharp differences between hypothetical performance results and the actual results subsequently achieved by any particular trading program. One of the limitations of hypothetical performance results is that they are generally prepared with the benefit of hindsight. In addition, hypothetical trading does not involve financial risk, and no hypothetical trading record can completely account for the impact of financial risk of actual trading. for example, the ability to withstand losses or to adhere to a particular trading program in spite of trading losses are material points which can also adversely affect actual trading results. There are numerous other factors related to the markets in general or to the implementation of any specific trading program which cannot be fully accounted for in the preparation of hypothetical performance results and all which can adversely affect trading results.
See more 'Legal Disclosures' in the bottom menu bar!