
Latest News
2022 Start working on a new website
BBS Trading Expert
Watch the Youtube BBS video and here is a crude oil trading example
Want to know more about:
AXIOM business books awards, bronze medal! Thank You!
No longer available!
Favorite articles in 2010, 11, 12, 14 and 2015 S&C Readers' Choice Awards.

AXIOM Business Books Awards, bronze medal.

Long term S&P500 analysis
September 2009
September 2, 2009. Looking at the S&P500 semi-logarithmic monthly chart since 1957, my Elliott count gives me a long term top for impulse wave [5] in 2007. This top was reached with a Fibonacci projection from the start and end of wave [1], exactly at the 1794% target, as did wave [3] already before.
What followed was a big correction until March 2009. It does perhaps not look that big on this semi-logarithmic scale, but looking at a linear scale in the next chart gives you certainly a better idea of the size of that reaction.
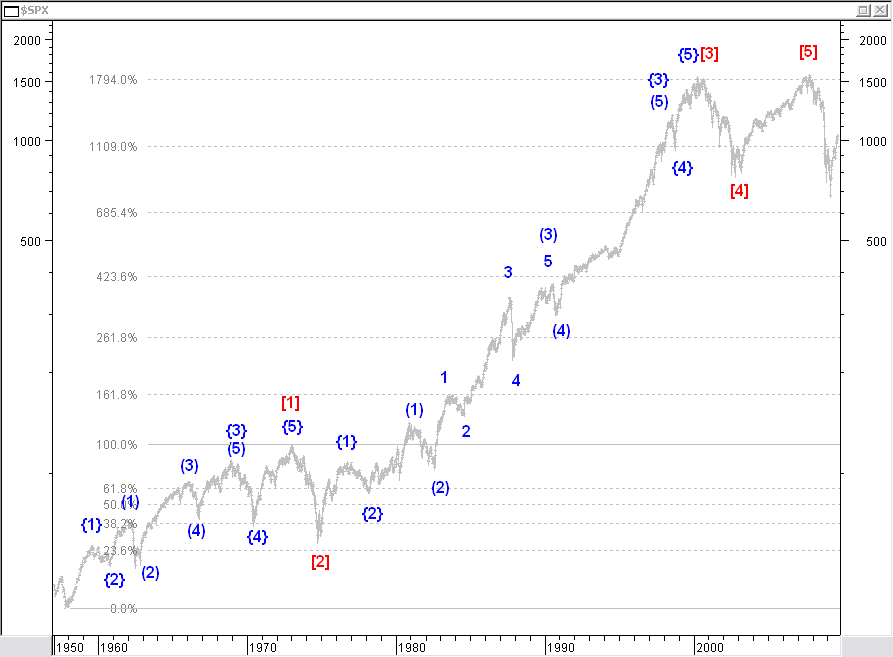
Counting the top as a 100% profit reference from the start of the up move, there was only about 40% left of that profit by March 2009. Is that enough reaction?
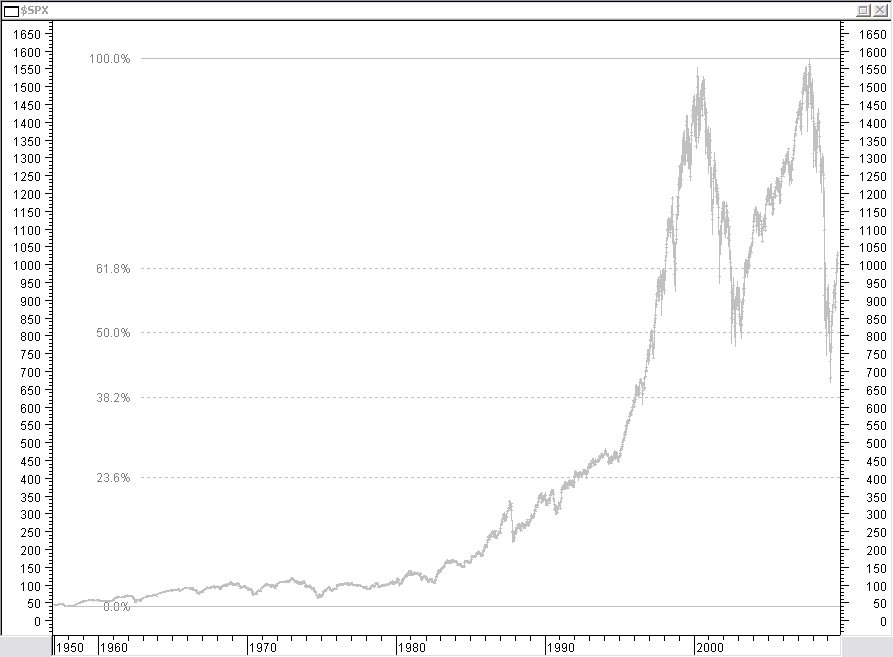
Let’s have a look what happened since March 2009 for a first future alternative in the following weekly chart.
Special offer: "Capturing Profit with technical Analysis"
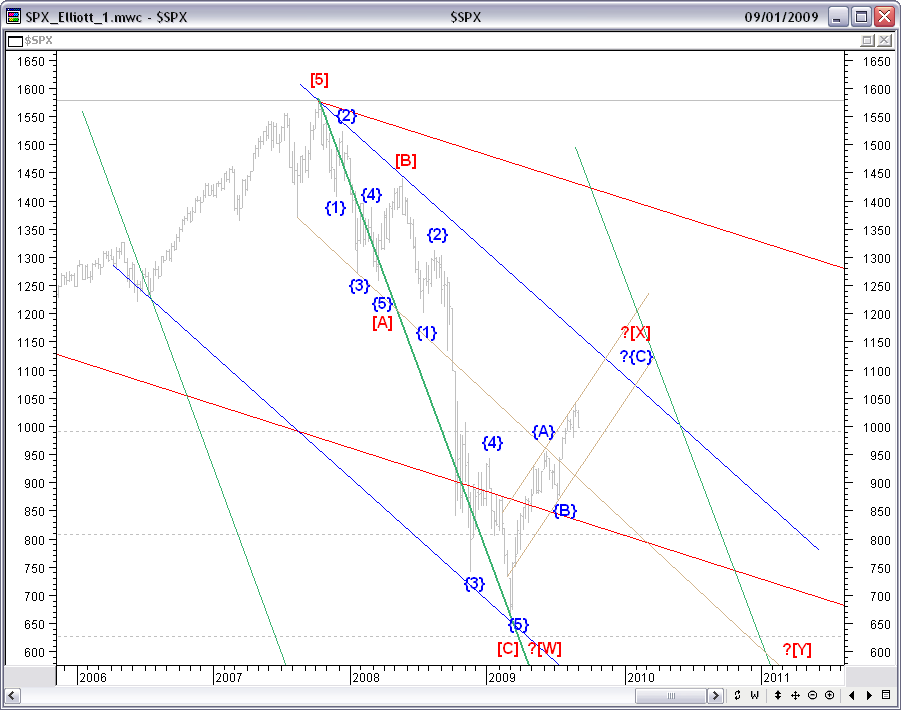
First we have a look at a possible bad scenario. Here we see the reaction until March 2009 not as a completed long term reaction. We had clearly a long term [ABC] correction. But we expect an extension to this first zigzag correction. So, we have made a wave [W], we are now making wave [X] up within a shorter term brown channel to about 1130 still this year. Next we will make a new low probably at the long term 38.2% Fibonacci retracement around 620 for the last correction wave [Y] somewhere in 2011. That is the bad news.
The good news is that we have most probably not yet reached the top of wave [X]. The normal price target for wave [X] is 50% retracement of wave [Y], which is around 1130. The blue downtrend line through [5] and [B] will give future resistance around that level. A parallel blue line through [X] gives us a long term downtrend channel. The top-bottom center-line through [5] and [C], with the action line to the left and the reaction line at the right, will also give resistance around the same level, forcing the index downwards with the same price inclination as the center-line once this level is reached.
The brown multi-reversal line around the middle of the long term down channel together with the reaction line and the 50% Fibonacci retracement level is the long term low target around 630 once wave [Y] is started. If this scenario is correct, you better be prepared. Not that I like it, but this is my preferred scenario for now.
Next let’s have a look at the following chart for a possible fantastic scenario for buying stocks now for many years to come.
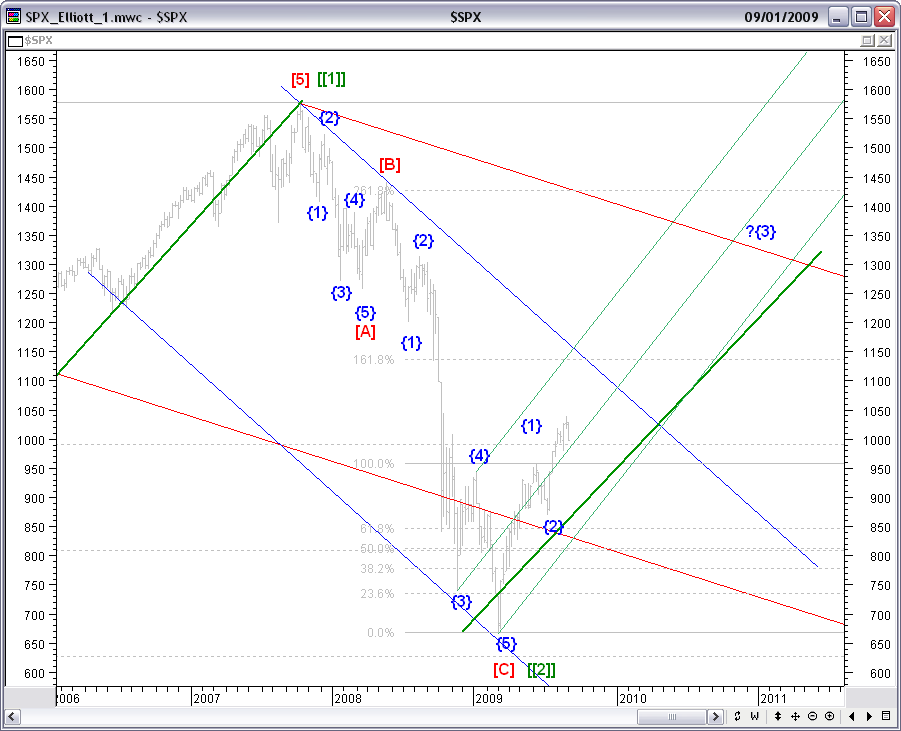
Here we like to believe that the long term correction has ended with wave [C] and that we have finished here a long term correction wave [[2]]. The next step is a long term wave [[3]] up that should bring us far above the last long term top. In this scenario we have finished wave {1} and wave {2} and are now making wave {3}. This wave {3} target seems to be somewhere between 1300 and 1400. The uptrend will most probably then continue the up move within the green up moving pitchfork. There will be resistance around 100 reaching the downtrend line and a Fibonacci target.
A green center-line through [5] and a previous low, with an action line (not visible), creates a reaction line that moves in-line with the pitchfork. Between 1300 and 1400 we also have the red line of the upper side of the long term downward pitchfork. These crossings look like a good wave {3} target to me.
Nice if this would be the near and long term future. But I have to say this is only my second alternative. So we better follow-up how it is going to develop further. The in-between reactions will most probably be confusing. What we should not do is believe that this is the only valid scenario and do nothing when my first preferred scenario starts happening.
Sleep well!
Links
Find a Stock ticker symbol, enter the ticker and find a chart, news, fundamentals and historical quotes.
Risk Disclosure: Futures and forex trading contains substantial risk and is not for every investor. An investor could potentially lose all or more than the initial investment. Risk capital is money that can be lost without jeopardizing ones’ financial security or life style. Only risk capital should be used for trading and only those with sufficient risk capital should consider trading. Past performance is not necessarily indicative of future results.
Hypothetical Performance Disclosure: Hypothetical performance results have many inherent limitations, some of which are described below. no representation is being made that any account will or is likely to achieve profits or losses similar to those shown; in fact, there are frequently sharp differences between hypothetical performance results and the actual results subsequently achieved by any particular trading program. One of the limitations of hypothetical performance results is that they are generally prepared with the benefit of hindsight. In addition, hypothetical trading does not involve financial risk, and no hypothetical trading record can completely account for the impact of financial risk of actual trading. for example, the ability to withstand losses or to adhere to a particular trading program in spite of trading losses are material points which can also adversely affect actual trading results. There are numerous other factors related to the markets in general or to the implementation of any specific trading program which cannot be fully accounted for in the preparation of hypothetical performance results and all which can adversely affect trading results.
See more 'Legal Disclosures' in the bottom menu bar!