
Latest News
2022 Start working on a new website
BBS Trading Expert
Watch the Youtube BBS video and here is a crude oil trading example
Want to know more about:
AXIOM business books awards, bronze medal! Thank You!
No longer available!
Favorite articles in 2010, 11, 12, 14 and 2015 S&C Readers' Choice Awards.

AXIOM Business Books Awards, bronze medal.

Long term, low risk high probability
profitable trading with SPY?
Part 3:
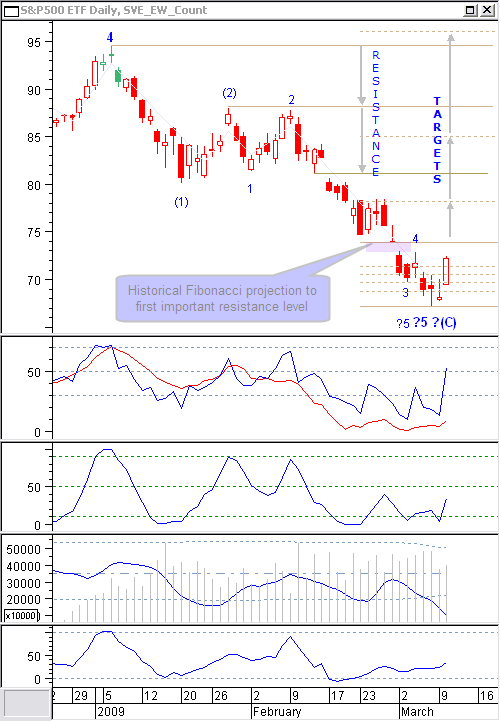
One day later, March 10 we have a confirmation of the turning point with a big white candle making up some kind of morning star candle pattern with the previous candles. Our buying price at the opening would still be OK. We can expect a first resistance at the level of the last exhaustion gap down.
Creating a normal up Fibonacci projection is not yet possible. What we can do is use my historical Fibonacci projection with a reference out of the past. The first important resistance level out of the past is the last gap window. Creating a Fibonacci projection with this reference point gives three targets which are also in the neighborhood of previous resistance levels. That means also a new up wave or a retracement back to the level of the previous wave 4, a very common target. Both these findings confirm our Fibonacci targets. The third Fibonacci target is around $95. From our buying point a profit of more than 30%.
Special offer: "Capturing Profit with technical Analysis"
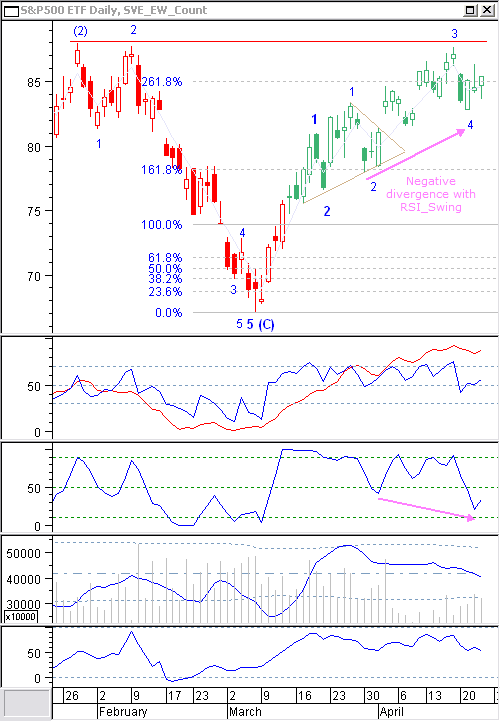
Up to April 23 we can see a very nice up move with a number of interesting technical analysis curiosities. The first gap resistance held only for one day. The first Fibonacci target could resist only two days. Then it took some time to consolidate with the formation of correction wave 2 and the start of wave 3 with an extension wave. Wave 2 of this extension wave found support on the 161.8% Fibonacci level, resistance now becoming support. Finally price broke out with a continuation gap and out of a small triangle continuation pattern to move up till the previous resistance level around $88. Price now consolidates around the 261.8% Fibonacci target, probably now finishing intermediate correction wave 4. Note the negative divergence between the higher bottoms in price between intermediate waves 2 and 4 while showing lower bottoms in the RSI_Swing oscillator. This confirms that a further up move can be expected. The SATS2 expert created a buy signal around half of March and is showing green candles since then.
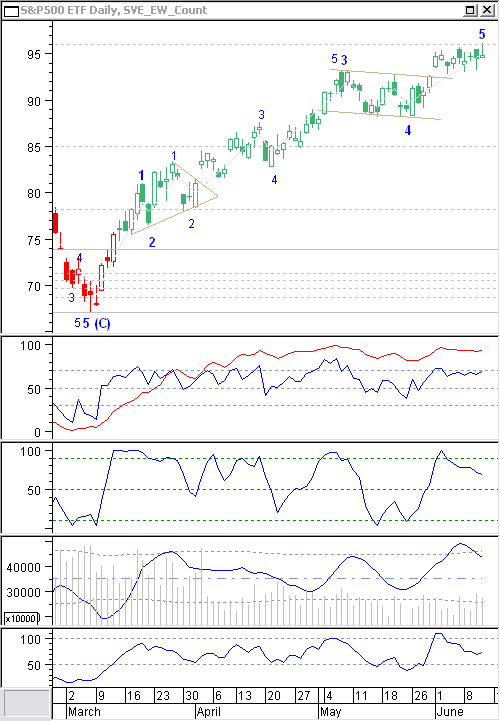
Next price makes intermediate wave top 5 and the top of wave 3. Correction wave 4 is a flat zigzag correction in the form of a flag pattern. Again price jumps out of this pattern with now most probably an exhaustion gap, reaching the Fibonacci target at 423.6%. Once you are that close to the target you should set a closing order here at about $95 and take more than 30% profit. If our wave count is correct, we have a completed wave and we expect a bigger correction either for a higher level wave 2 or a correction wave B. Note how indicators stayed mostly above their median level during the whole up move. Only the fast RSI_Swing returned to the 0-level for correction wave 4. Now all indicators are turning down and ARSI even with a divergence. In the candle chart we have a shooting star reversal candle.
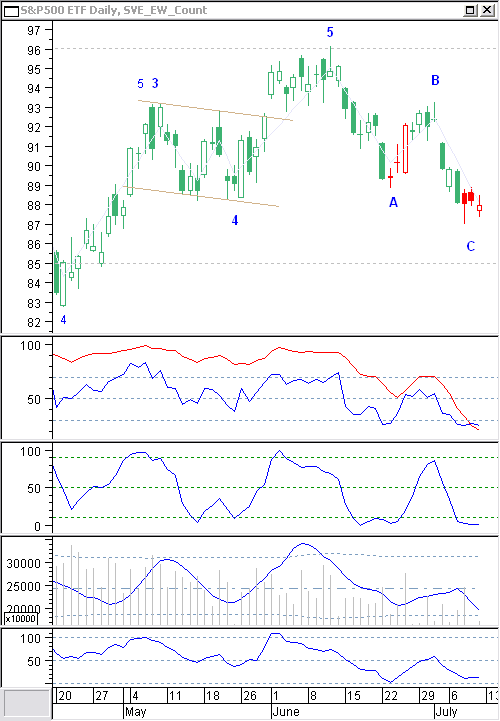
And where are we today?
Up to now we have made a nice ABC correction pattern, which may be close to the end. All indicators are at the lower side, inclusive the longer term slow stochastic. We are waiting for a reversal signal for a new up move for a new longer term wave 3 or a wave C.
I hope you enjoy and that you will learn something from these three mailings about “Long term, low risk high probability profitable trading with SPY?”
Have a nice day.
Previous -Part 1 -Part 2 -Part 3
Links
Find a Stock ticker symbol, enter the ticker and find a chart, news, fundamentals and historical quotes.
Risk Disclosure: Futures and forex trading contains substantial risk and is not for every investor. An investor could potentially lose all or more than the initial investment. Risk capital is money that can be lost without jeopardizing ones’ financial security or life style. Only risk capital should be used for trading and only those with sufficient risk capital should consider trading. Past performance is not necessarily indicative of future results.
Hypothetical Performance Disclosure: Hypothetical performance results have many inherent limitations, some of which are described below. no representation is being made that any account will or is likely to achieve profits or losses similar to those shown; in fact, there are frequently sharp differences between hypothetical performance results and the actual results subsequently achieved by any particular trading program. One of the limitations of hypothetical performance results is that they are generally prepared with the benefit of hindsight. In addition, hypothetical trading does not involve financial risk, and no hypothetical trading record can completely account for the impact of financial risk of actual trading. for example, the ability to withstand losses or to adhere to a particular trading program in spite of trading losses are material points which can also adversely affect actual trading results. There are numerous other factors related to the markets in general or to the implementation of any specific trading program which cannot be fully accounted for in the preparation of hypothetical performance results and all which can adversely affect trading results.
See more 'Legal Disclosures' in the bottom menu bar!