
Latest News
2022 Start working on a new website
BBS Trading Expert
Watch the Youtube BBS video and here is a crude oil trading example
Want to know more about:
AXIOM business books awards, bronze medal! Thank You!
No longer available!
Favorite articles in 2010, 11, 12, 14 and 2015 S&C Readers' Choice Awards.

AXIOM Business Books Awards, bronze medal.

Long term, low risk high probability
profitable trading with SPY?
Part 2:
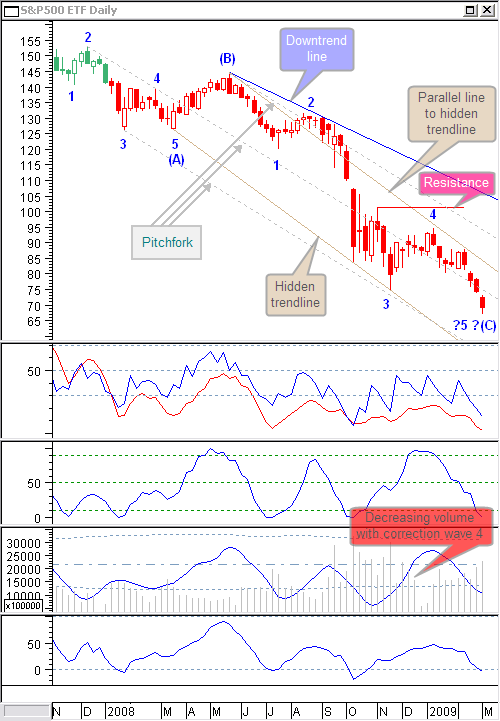
Did price reach a low for wave 3 on November 21, 2008? Looking at the next weekly chart, apparently it did. At that point we can ask the question, up to what level will price react to complete wave 4?
We can draw a number of lines to see where there are resistance levels. The blue trendline from the top of wave (B) through the top of wave 2 is probably the most distant resistance we can expect for this reaction. An inverse brown trendline through the previous wave 5 bottom and the new wave 3 bottom is touched 3 times. A parallel line moved to the top of wave (B) gives a much closer resistance level. We can also draw a pitchfork through the points (B), 2 and 3 from the previous wave (dashed grey lines). This makes up a target between the two previous ones. Finally we have the horizontal red line that makes up the resistance level of the previous top. So, that moment in time, you could expect a reaction to any of these points. That we were dealing with a correction was confirmed by decreasing volume during the up move. Pretty soon it became clear that the upper side of the trend channel was the resistance that turned wave 4 down to start wave 5.
Special offer: "Capturing Profit with technical Analysis"
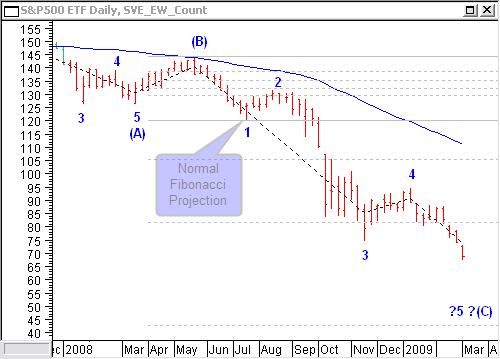
On March 6, 2009 we have a valid wave 5 and correction wave (C).
Is there a way we can see if price really reached a bottom? Let’s try it with a (standard) Fibonacci projection. Here the 423.6 third level projection around $45 seems too far down, price would have to drop another 50% to reach this point.
What about using one of my favorites, I call it a historical Fibonacci projection, projecting using a previous turning point. Here the 423.6% projection is giving exact support at the actual price level.
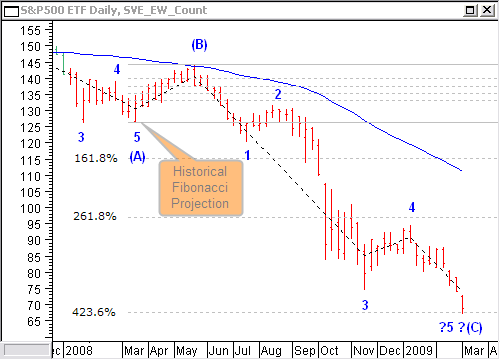
This confirms that you best start having a look at the daily chart.
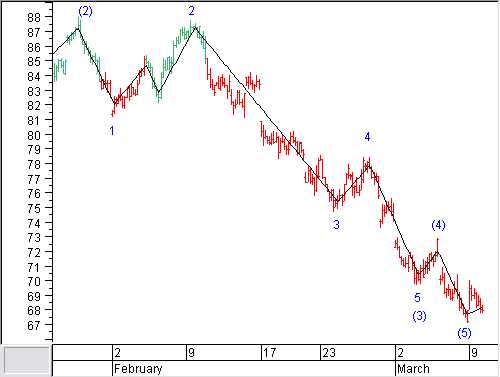
We are next looking at the daily candlestick chart on March 9, 2009 one day after the weekly chart of March 6.
We have a strong buying incentive here with a very good risk-to-reward ratio. Buying now at the closing price of $68.11 and keeping a stop at the low of $67.1 gives a very small initial stop loss and if we are at the start of a new longer term uptrend the risk-to-reward is extremely good. We do not only reach a Fibonacci target but there is also an inverted hammer which is a candlestick buying pattern after confirmation. Additionally, all indicators are oversold for some time now.
The only thing which could create some doubt is the fact that we are maybe just completing the bottom of intermediate wave 3, at least that is the way it looks on the daily chart. Then we still expect wave 5 down with a bottom below wave 3 and that would get us out of the trade using an initial stop.
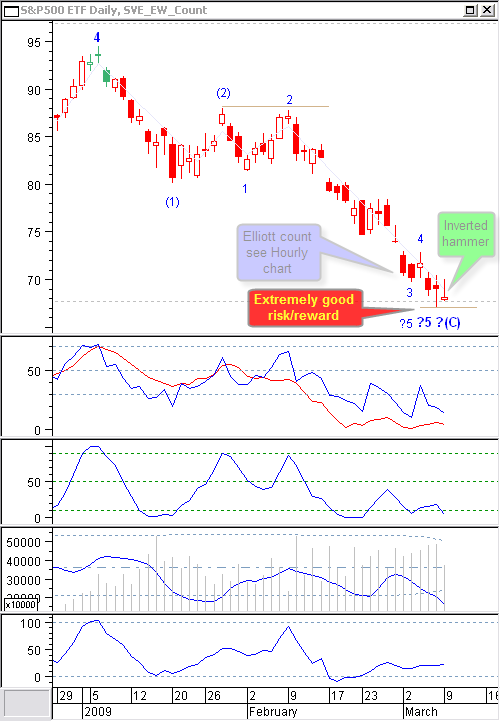
Let’s have a look at the hourly chart looking for an Elliot wave count confirmation of the completion of wave (3) or wave (5). The most logical count here confirms the completion of wave (5). So, there is no reason not to take the trade at the closing of March 9 or at the opening of March 10.
In the next part we will find out if we are making any money.
Next -Previous -Part 1 -Part 2 -Part 3
Links
Find a Stock ticker symbol, enter the ticker and find a chart, news, fundamentals and historical quotes.
Risk Disclosure: Futures and forex trading contains substantial risk and is not for every investor. An investor could potentially lose all or more than the initial investment. Risk capital is money that can be lost without jeopardizing ones’ financial security or life style. Only risk capital should be used for trading and only those with sufficient risk capital should consider trading. Past performance is not necessarily indicative of future results.
Hypothetical Performance Disclosure: Hypothetical performance results have many inherent limitations, some of which are described below. no representation is being made that any account will or is likely to achieve profits or losses similar to those shown; in fact, there are frequently sharp differences between hypothetical performance results and the actual results subsequently achieved by any particular trading program. One of the limitations of hypothetical performance results is that they are generally prepared with the benefit of hindsight. In addition, hypothetical trading does not involve financial risk, and no hypothetical trading record can completely account for the impact of financial risk of actual trading. for example, the ability to withstand losses or to adhere to a particular trading program in spite of trading losses are material points which can also adversely affect actual trading results. There are numerous other factors related to the markets in general or to the implementation of any specific trading program which cannot be fully accounted for in the preparation of hypothetical performance results and all which can adversely affect trading results.
See more 'Legal Disclosures' in the bottom menu bar!