
Latest News
2022 Start working on a new website
BBS Trading Expert
Watch the Youtube BBS video and here is a crude oil trading example
Want to know more about:
AXIOM business books awards, bronze medal! Thank You!
No longer available!
Favorite articles in 2010, 11, 12, 14 and 2015 S&C Readers' Choice Awards.

AXIOM Business Books Awards, bronze medal.

Long term, low risk high probability
profitable trading with SPY?
Part 1:
If you do not have the time tracking many stocks to spread your risk, you can use an ETF (Exchange Traded Fund) like SPY, a tracker based on the S&P500 index. That way your risk is spread over 500 stocks.
Of course you still need to apply money and risk management, meaning you would also use an initial and a trailing stop.
You are looking for the larger price moves, hence the longer term. You are also looking for trades that would give you a high probability of being profitable. This means you would either enter a trade in the direction of the main longer term trend after a trend reaction or at a longer term turning point.
Special offer: "Capturing Profit with technical Analysis"
Assume it is November 21, 2008 and you are looking at the weekly chart of SPY (figure 1).
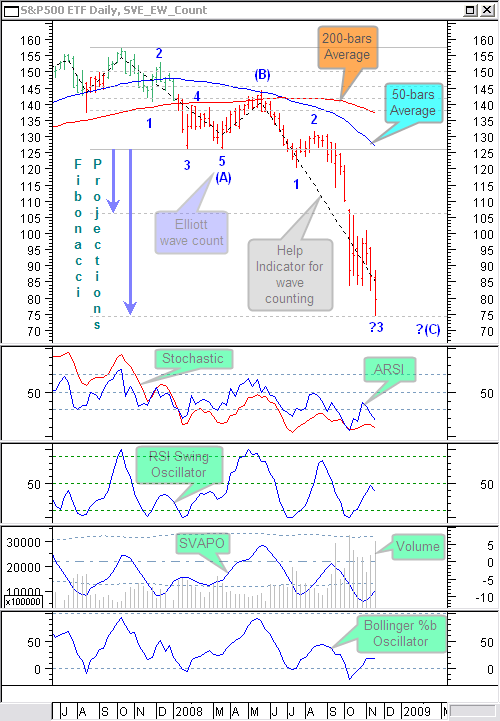
Figure 1: SPY weekly chart.
Price made a longer term top the week ending October 12, 2007. Since then there has been a long term large correction. Could this be the end of the long term downtrend? There is a valid correction wave count (A)(B)(C), but has price reached the bottom of wave (C)?
All indicators are turning up from oversold areas (we will talk about these indicators later on). However key turning points are nine times out of ten signaled by a divergence between price (lower bottoms) and the indicators (higher bottoms). This is not the case here! Volume is high and moving up. At a key reversal point you would expect rather a decreasing volume. All this seems to be confirmed by the Elliott wave count. A C-wave is normally a 5-impulse wave. Here it looks like we are just at the count of 3. Reason why you would rather expect a temporary up correction creating wave 4 and not a long term key reversal point.
Correction wave (A) is normally also a 5-impulse wave. This is not very visible on the weekly chart. But looking at the daily chart in figure 2, this 5-impulse wave count is nicely confirmed.
.png)
Figure 2: Elliott count on daily chart for correction wave (A).
In the weekly chart of figure 1, you can also see how price reaches a second Fibonacci target at 261.8%. It is clear that you expect here a price up move. But based on all other findings you expect this to be a correction in the long term downtrend and not a long term key reversal point. Further following up price evolution on the weekly chart is the best choice for now. Next time we will look at the further price evolution.
A word about the chart in figure 1. The averages used on the bar chart are a 50-days and a 200 days simple moving average. The help indicator for wave counting is a proprietary indicator based on the zigzag function. It is just used to help you counting waves. The 14 bars ARSI is my modified asymmetrical RSI indicator that was published in Stocks and Commodities magazine October 2008. The stochastic here is a slow 50 bars stochastic with 3 bars slowing. The RSI swing oscillator is a proprietary oscillator based on the RSI to show short time swing points with as little delay as possible. Most of the time double bottoms or tops appear at more important turning points. Volume is just the raw volume traded in SPY. SVAPO, Short Term Volume And Price Oscillator, is my own indicator published in Stocks and Commodities magazine November 2007. The Bollinger %b is a modified version of the standard Bollinger %b oscillator used as a leading indicator. This is the MetaStock code for this oscillator:
peri:=Input("period: ",2,100,18);
haOpen:=(Ref((O+H+L+C)/4,-1) + PREV)/2;
haC:=((O+H+L+C)/4+haOpen+Max(H,haOpen)+Min(L,haOpen))/4;
((haC+2*Stdev(haC,peri)-Mov(haC,peri,W))/(4*Stdev(haC,peri)))*100
Links
Find a Stock ticker symbol, enter the ticker and find a chart, news, fundamentals and historical quotes.
Risk Disclosure: Futures and forex trading contains substantial risk and is not for every investor. An investor could potentially lose all or more than the initial investment. Risk capital is money that can be lost without jeopardizing ones’ financial security or life style. Only risk capital should be used for trading and only those with sufficient risk capital should consider trading. Past performance is not necessarily indicative of future results.
Hypothetical Performance Disclosure: Hypothetical performance results have many inherent limitations, some of which are described below. no representation is being made that any account will or is likely to achieve profits or losses similar to those shown; in fact, there are frequently sharp differences between hypothetical performance results and the actual results subsequently achieved by any particular trading program. One of the limitations of hypothetical performance results is that they are generally prepared with the benefit of hindsight. In addition, hypothetical trading does not involve financial risk, and no hypothetical trading record can completely account for the impact of financial risk of actual trading. for example, the ability to withstand losses or to adhere to a particular trading program in spite of trading losses are material points which can also adversely affect actual trading results. There are numerous other factors related to the markets in general or to the implementation of any specific trading program which cannot be fully accounted for in the preparation of hypothetical performance results and all which can adversely affect trading results.
See more 'Legal Disclosures' in the bottom menu bar!