
Latest News
2022 Start working on a new website
BBS Trading Expert
Watch the Youtube BBS video and here is a crude oil trading example
Want to know more about:
AXIOM business books awards, bronze medal! Thank You!
No longer available!
Favorite articles in 2010, 11, 12, 14 and 2015 S&C Readers' Choice Awards.

AXIOM Business Books Awards, bronze medal.

Band Break System Trading
Avoiding losing trades Part 2 - Trading Long
BBS - Intro - Results - Template - Basic - More_money - Selecting_stocks
Avoid losing trades PART1 - PART2 - PART3 - PART4 - Stock_Selection
November 17 2000, we have a BBS buying signal for Autodesk Inc.
What are the negative points?
- We are apparently in a long term downtrend.
- There is resistance of the 100 day moving average.
- S10_RSI_Xtreme is moving down.
- S10_Stoch_Xtreme is moving down.
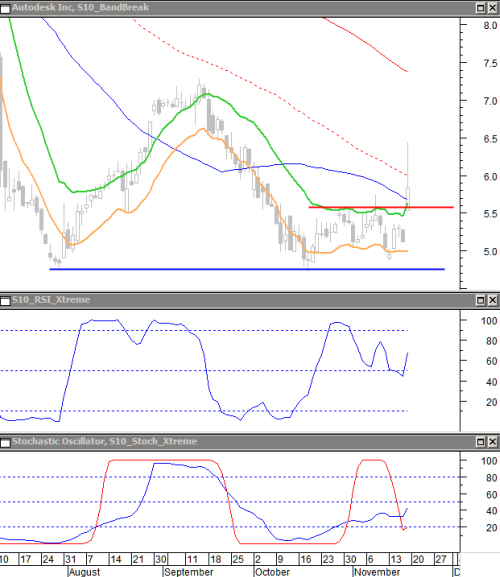
What are the positive points?
- The low price mid-October bounced up on the support from end of July (blue horizontal line).
- Half of November this support is confirmed once more (with a morning star pattern in the candle chart).
- The resistance line around $5.6 is broken with the closing price.
- The blue 50 day average line is broken with a closing price.
- The last candle makes a big gap and a large move up.
- It looks like the up move started already beginning of October, now taking of for the bigger move. This would explain the contradictory indicators.
With these pros and cons we would follow BBS and open a long trade.
During the up move we can see the resistance of the 100 day average being broken and then a move up to the resistance of the 165 moving average and around that level the resistance of the top of September.
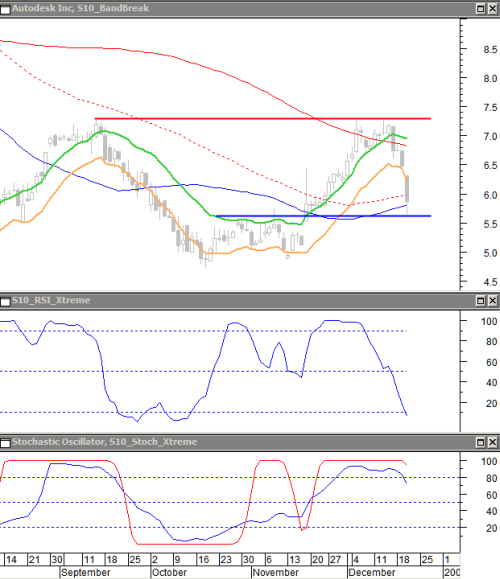
Now the lower side of the BBS channel is broken. This brings the trade back to a break-even position.
Shall we follow BBS and close the position?
I would give it at least another day for a number of reasons:
- The resistance encountered at about $7.3 is completely normal.
- The rather big fall-back after that is normal since the only available support are the levels of the 100 and 50 day average.
- Price now finds support on the 50 day average and a previous resistance (blue line), now becoming support.
- After a big correction in just 4 days we should expect a price up reaction.
- The fast short term S10_RSI_Xtreme indicator is already touching a low level.
Enough reasons to wait and see what is coming tomorrow.
After a few days of consolidation on support levels, price resumed the uptrend, moving back into the BBS channel.
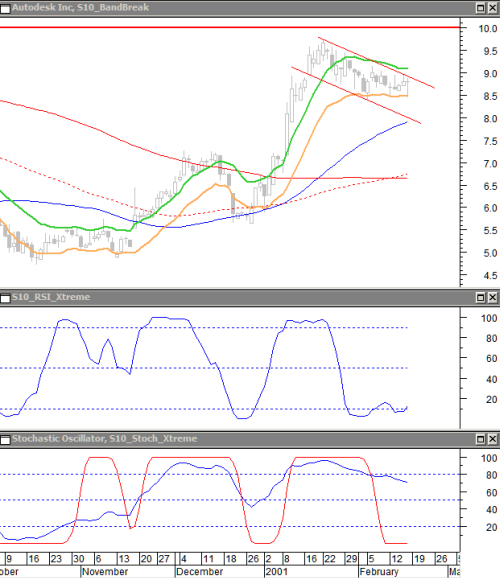
Price reaches a top half of January. This top is a longer term previous resistance level (red line) and a psychological price level of $10. At that level there was also a 100% price increase from the start of the up move.
It seems logical that we are now ready for a downward correction. Unfortunately there is no nearby support. The first support is at the level of 50 day average. Price is moving in a downward channel (red), the medium term stochastic oscillator keeps moving down and the fast S10_RSI_Xtreme continues moving at the bottom.
In these circumstances it is worthwhile not to wait for a selling signal and take profit now.
Avoid losing trades part3 NEXT -Avoid losing trades part1
STOCATA Stocks Technical Analysis HOME
Links
Find a Stock ticker symbol, enter the ticker and find a chart, news, fundamentals and historical quotes.
Risk Disclosure: Futures and forex trading contains substantial risk and is not for every investor. An investor could potentially lose all or more than the initial investment. Risk capital is money that can be lost without jeopardizing ones’ financial security or life style. Only risk capital should be used for trading and only those with sufficient risk capital should consider trading. Past performance is not necessarily indicative of future results.
Hypothetical Performance Disclosure: Hypothetical performance results have many inherent limitations, some of which are described below. no representation is being made that any account will or is likely to achieve profits or losses similar to those shown; in fact, there are frequently sharp differences between hypothetical performance results and the actual results subsequently achieved by any particular trading program. One of the limitations of hypothetical performance results is that they are generally prepared with the benefit of hindsight. In addition, hypothetical trading does not involve financial risk, and no hypothetical trading record can completely account for the impact of financial risk of actual trading. for example, the ability to withstand losses or to adhere to a particular trading program in spite of trading losses are material points which can also adversely affect actual trading results. There are numerous other factors related to the markets in general or to the implementation of any specific trading program which cannot be fully accounted for in the preparation of hypothetical performance results and all which can adversely affect trading results.
See more 'Legal Disclosures' in the bottom menu bar!