
Latest News
2022 Start working on a new website
BBS Trading Expert
Watch the Youtube BBS video and here is a crude oil trading example
Want to know more about:
AXIOM business books awards, bronze medal! Thank You!
No longer available!
Favorite articles in 2010, 11, 12, 14 and 2015 S&C Readers' Choice Awards.

AXIOM Business Books Awards, bronze medal.

Band Break System Trading
Avoiding losing trades Part 4 - Non-profitable trades
BBS - Intro - Results - Template - Basic - More_money - Selecting_stocks
Avoid losing trades PART1 - PART2 - PART3 - PART4 - Stock_Selection
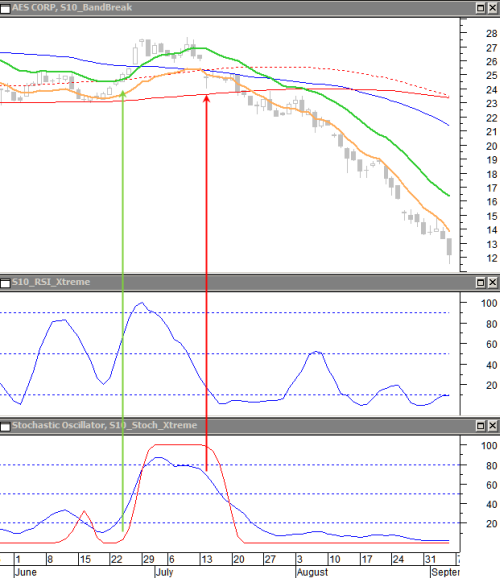
Most non-profitable trades in a trend following system like BBS, will occur with buying signals appearing during an upward correction in a medium to longer term down or flat trend.
Looking at the daily chart in the following figure there is a BBS buying signal.
Price found support on the 165 day average and support from a previous low. It now breaks above the 100 day average. All indicators are moving up from low levels.
There is apparently no reason why you should not take this trade.
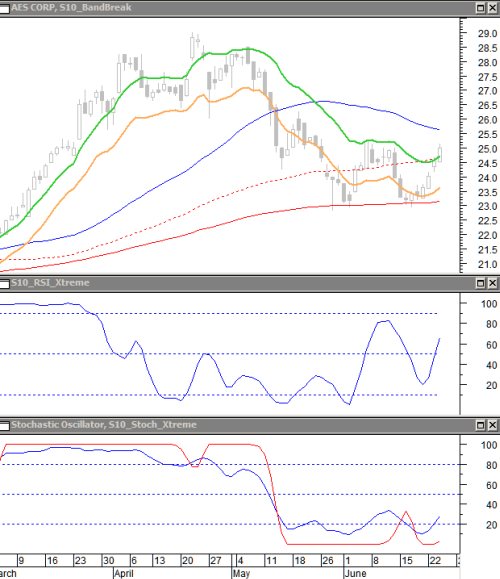
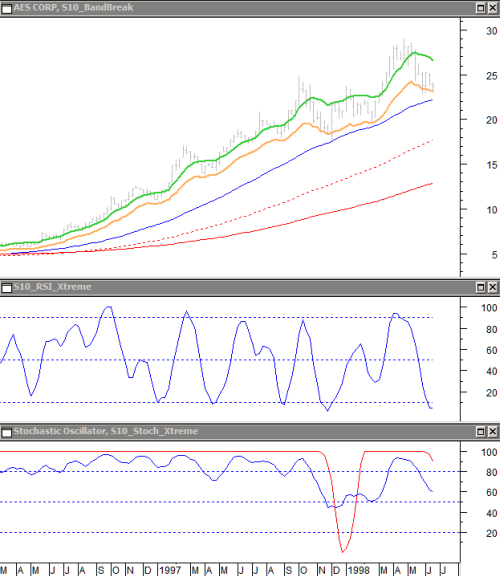
This is typically one of more reasons why you should always have a look at the longer term trend. Opening the same chart on a weekly basis you can see a very large up move for more than 2 years.
If a longer term price reaction is started now, the down move up to now will certainly not be the end of the reaction already. So, you should be aware that an up move now may just be a small correction in the future longer term down move.
You can use my book '"Capturing Profit with Technical Analysis" and use the part about price targets and Elliott wave counts to estimate if price reached a target. That can give you the extra information you need to make a decision.
If for any good reason you entered this trade based on the BBS signal, make sure you get out on the first BBS selling signal. Right away when it becomes clear that a long term down move has started.
Avoid losing trades part3 PREVIOUS -Avoid losing trades start
STOCATA Stocks Technical Analysis HOME
Links
Find a Stock ticker symbol, enter the ticker and find a chart, news, fundamentals and historical quotes.
Risk Disclosure: Futures and forex trading contains substantial risk and is not for every investor. An investor could potentially lose all or more than the initial investment. Risk capital is money that can be lost without jeopardizing ones’ financial security or life style. Only risk capital should be used for trading and only those with sufficient risk capital should consider trading. Past performance is not necessarily indicative of future results.
Hypothetical Performance Disclosure: Hypothetical performance results have many inherent limitations, some of which are described below. no representation is being made that any account will or is likely to achieve profits or losses similar to those shown; in fact, there are frequently sharp differences between hypothetical performance results and the actual results subsequently achieved by any particular trading program. One of the limitations of hypothetical performance results is that they are generally prepared with the benefit of hindsight. In addition, hypothetical trading does not involve financial risk, and no hypothetical trading record can completely account for the impact of financial risk of actual trading. for example, the ability to withstand losses or to adhere to a particular trading program in spite of trading losses are material points which can also adversely affect actual trading results. There are numerous other factors related to the markets in general or to the implementation of any specific trading program which cannot be fully accounted for in the preparation of hypothetical performance results and all which can adversely affect trading results.
See more 'Legal Disclosures' in the bottom menu bar!