
Latest News
2022 Start working on a new website
BBS Trading Expert
Watch the Youtube BBS video and here is a crude oil trading example
Want to know more about:
AXIOM business books awards, bronze medal! Thank You!
No longer available!
Favorite articles in 2010, 11, 12, 14 and 2015 S&C Readers' Choice Awards.

AXIOM Business Books Awards, bronze medal.

Technical Analysis Averages Part 2
Importance of the 20-, 50-, and 200-day Simple Averages
You must pay special attention to support and resistance of the 20-, 50-, and 200-day simple moving average. Additionally, the 20-day simple moving average is a nice tool to help you estimating the inclination of the shorter term trendline.
The 20-, 50-, and 200-day simple moving averages were mostly used in the past before the advent of personal computers. A simple average was used because the calculation was simple; longer periods were used because the movements in those days took time to take off and to complete.
Special offer: "Capturing Profit with technical Analysis"
This tradition is still alive today in the sense that investors still watch these averages. That is the reason why prices generally experience support and resistance at the level of these averages.
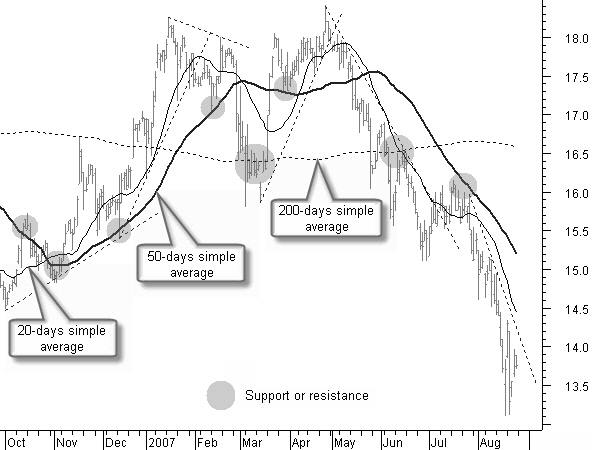
Figure 4.36: The 20, 50 and 200 days moving average.
In figure 4.36, note how the 20-day average gives direction to the shorter period price move and often runs parallel with a trendline.
The 50-day moving average gives direction to the medium-time period. If the price is moving above this average, it is good to have this share in your portfolio. If the price, however, moves below the 50-day average, it is better not to have this share in possession.
The 200-day moving average is important for a look at the long-term trend.
Around the 50- and the 200-day averages, you will almost always notice some form of support or resistance.
Technical Analysis Averages NEXT -Previous -Part 1 -Part 2 -Part 3 -Part 4
STOCATA Stocks Technical Analysis HOME
Links
Find a Stock ticker symbol, enter the ticker and find a chart, news, fundamentals and historical quotes.
Risk Disclosure: Futures and forex trading contains substantial risk and is not for every investor. An investor could potentially lose all or more than the initial investment. Risk capital is money that can be lost without jeopardizing ones’ financial security or life style. Only risk capital should be used for trading and only those with sufficient risk capital should consider trading. Past performance is not necessarily indicative of future results.
Hypothetical Performance Disclosure: Hypothetical performance results have many inherent limitations, some of which are described below. no representation is being made that any account will or is likely to achieve profits or losses similar to those shown; in fact, there are frequently sharp differences between hypothetical performance results and the actual results subsequently achieved by any particular trading program. One of the limitations of hypothetical performance results is that they are generally prepared with the benefit of hindsight. In addition, hypothetical trading does not involve financial risk, and no hypothetical trading record can completely account for the impact of financial risk of actual trading. for example, the ability to withstand losses or to adhere to a particular trading program in spite of trading losses are material points which can also adversely affect actual trading results. There are numerous other factors related to the markets in general or to the implementation of any specific trading program which cannot be fully accounted for in the preparation of hypothetical performance results and all which can adversely affect trading results.
See more 'Legal Disclosures' in the bottom menu bar!