
Latest News
2022 Start working on a new website
BBS Trading Expert
Watch the Youtube BBS video and here is a crude oil trading example
Want to know more about:
AXIOM business books awards, bronze medal! Thank You!
No longer available!
Favorite articles in 2010, 11, 12, 14 and 2015 S&C Readers' Choice Awards.

AXIOM Business Books Awards, bronze medal.

Technical Analysis Averages Part 3
TEMA Average
The TEMA average is generally not used directly on a chart. This average is however used in many formulas to smooth longer periods of data with only a small amount of lag.
The TEMA, or Triple Exponential Moving Average, was introduced by Patrick Mulloy in Technical Analysis of Stocks & Commodities magazine, February 1994.
Special offer: "Capturing Profit with technical Analysis"
TEMA is not simply a triple exponential moving average, as you probably would assume from the name. The intention of TEMA is to limit the typical lag of an average.
An ‘n’ day exponential average (EMA) has a smoothing factor alpha of:
![]()
and a delay of
![]() .
.
The larger the average period n, the better the smoothing, but, unfortunately, the larger the delay. TEMA uses a technique of John Wilder Tukey to compensate the delay. The data is sent several times through the same filter and combined afterward:
TEMA = (3*EMA – 3*EMA(EMA)) + EMA(EMA(EMA))
The application of the TEMA average makes most sense if we want to smooth larger data periods, whereas the delay must remain as small as possible.
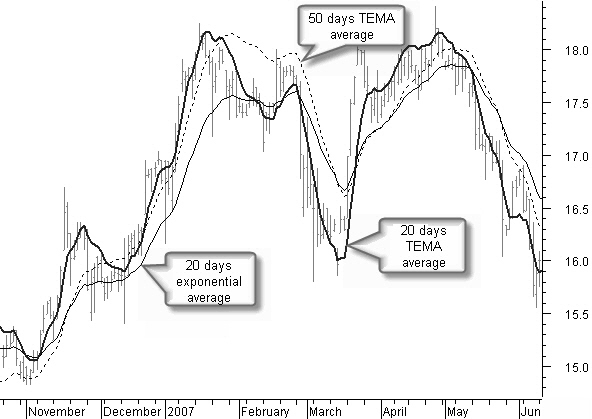
Figure 4.37: TEMA average.
Compare in figure 4.37 the 50-day TEMA average with the 20-day exponential average. You can see that the much longer TEMA average is at least as fast at the reversal points as the exponential average.
Technical Analysis Averages NEXT -Previous -Part 1 -Part 2 -Part 3 -Part 4
STOCATA Stocks Technical Analysis HOME
Links
Find a Stock ticker symbol, enter the ticker and find a chart, news, fundamentals and historical quotes.
Risk Disclosure: Futures and forex trading contains substantial risk and is not for every investor. An investor could potentially lose all or more than the initial investment. Risk capital is money that can be lost without jeopardizing ones’ financial security or life style. Only risk capital should be used for trading and only those with sufficient risk capital should consider trading. Past performance is not necessarily indicative of future results.
Hypothetical Performance Disclosure: Hypothetical performance results have many inherent limitations, some of which are described below. no representation is being made that any account will or is likely to achieve profits or losses similar to those shown; in fact, there are frequently sharp differences between hypothetical performance results and the actual results subsequently achieved by any particular trading program. One of the limitations of hypothetical performance results is that they are generally prepared with the benefit of hindsight. In addition, hypothetical trading does not involve financial risk, and no hypothetical trading record can completely account for the impact of financial risk of actual trading. for example, the ability to withstand losses or to adhere to a particular trading program in spite of trading losses are material points which can also adversely affect actual trading results. There are numerous other factors related to the markets in general or to the implementation of any specific trading program which cannot be fully accounted for in the preparation of hypothetical performance results and all which can adversely affect trading results.
See more 'Legal Disclosures' in the bottom menu bar!